| __timestamp | AMETEK, Inc. | TransUnion |
|---|---|---|
| Wednesday, January 1, 2014 | 1023344000 | 429400000 |
| Thursday, January 1, 2015 | 1093776000 | 478200000 |
| Friday, January 1, 2016 | 1007213000 | 585300000 |
| Sunday, January 1, 2017 | 1068174000 | 701100000 |
| Monday, January 1, 2018 | 1269415000 | 819800000 |
| Tuesday, January 1, 2019 | 1411422000 | 993200000 |
| Wednesday, January 1, 2020 | 1283159000 | 883400000 |
| Friday, January 1, 2021 | 1600782000 | 1010500000 |
| Saturday, January 1, 2022 | 1820119000 | 1173800000 |
| Sunday, January 1, 2023 | 2025843000 | 667300000 |
| Monday, January 1, 2024 | 1779562000 | 1204100000 |
Unleashing insights
In the ever-evolving landscape of corporate finance, EBITDA serves as a crucial metric for evaluating a company's operational performance. Over the past decade, AMETEK, Inc. has consistently outperformed TransUnion in terms of EBITDA growth. Starting in 2014, AMETEK's EBITDA was approximately 138% higher than TransUnion's. By 2023, this gap widened, with AMETEK's EBITDA more than tripling TransUnion's, showcasing a robust growth trajectory.
This analysis underscores the importance of strategic planning and adaptability in maintaining financial health and competitive advantage.
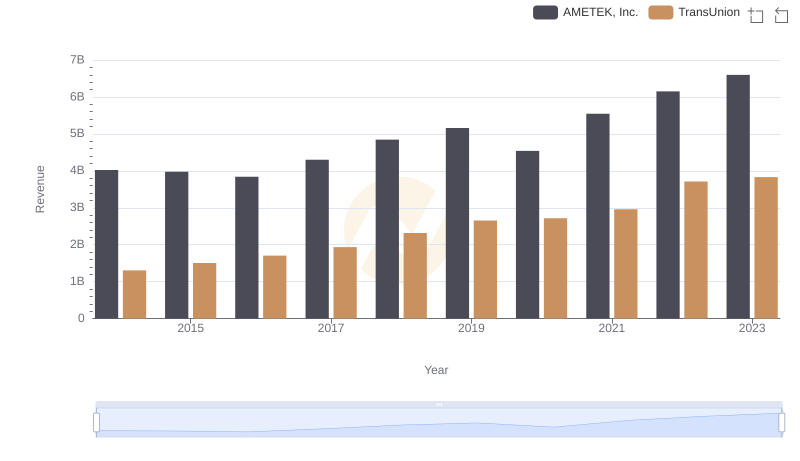
AMETEK, Inc. vs TransUnion: Examining Key Revenue Metrics
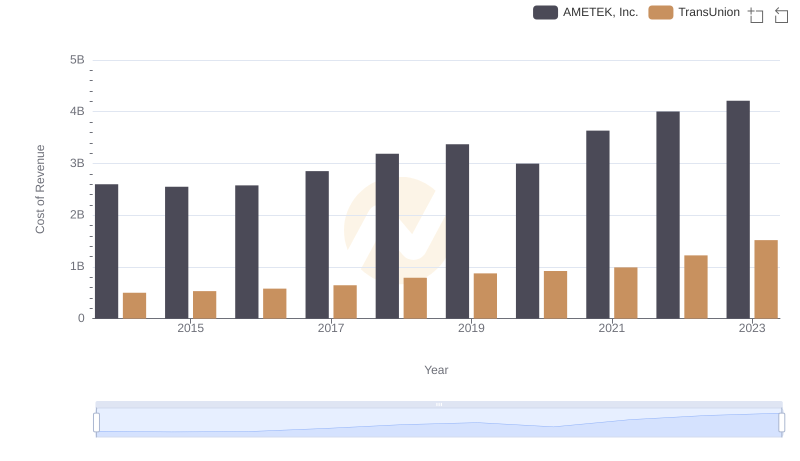
Cost of Revenue: Key Insights for AMETEK, Inc. and TransUnion

AMETEK, Inc. or TransUnion: Who Manages SG&A Costs Better?
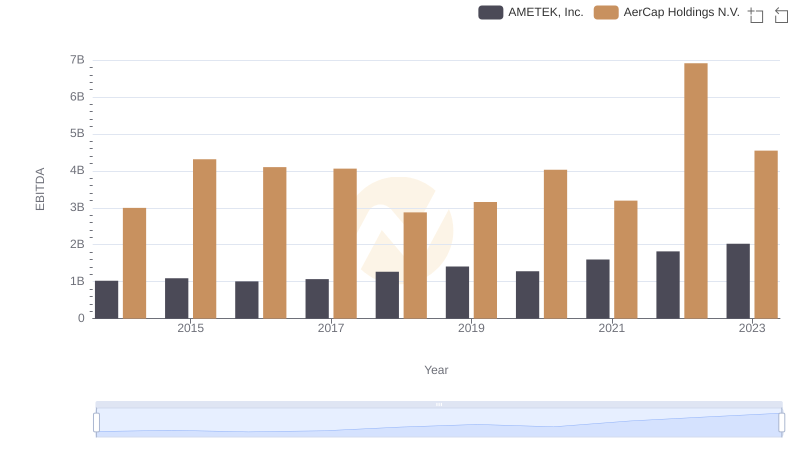
AMETEK, Inc. vs AerCap Holdings N.V.: In-Depth EBITDA Performance Comparison
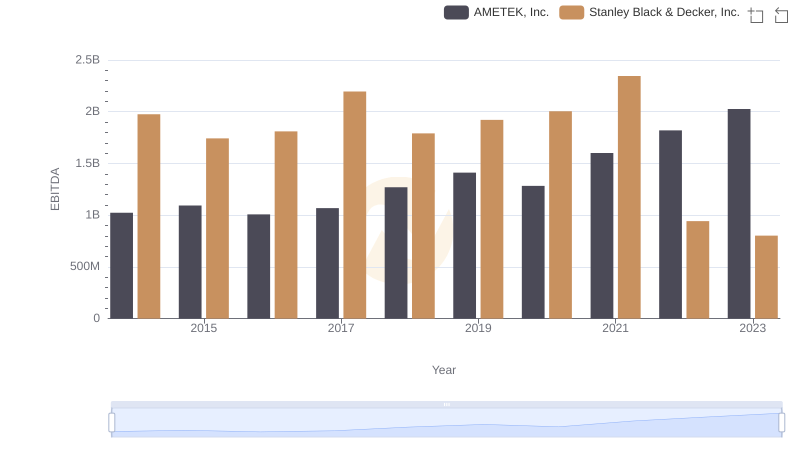
Comparative EBITDA Analysis: AMETEK, Inc. vs Stanley Black & Decker, Inc.
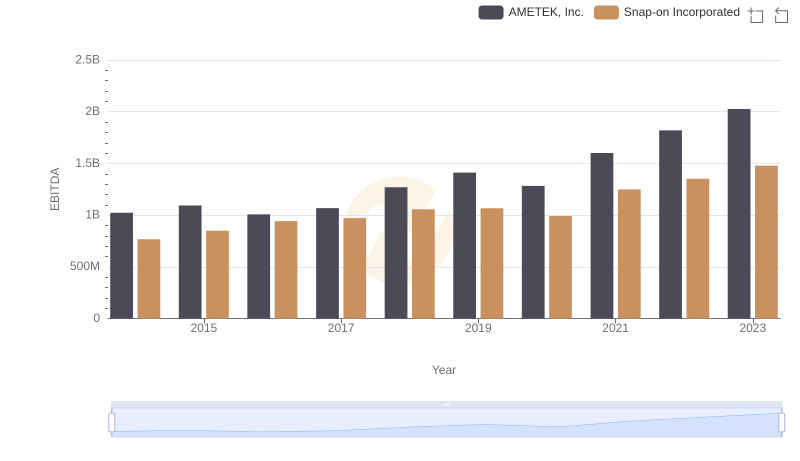
A Side-by-Side Analysis of EBITDA: AMETEK, Inc. and Snap-on Incorporated
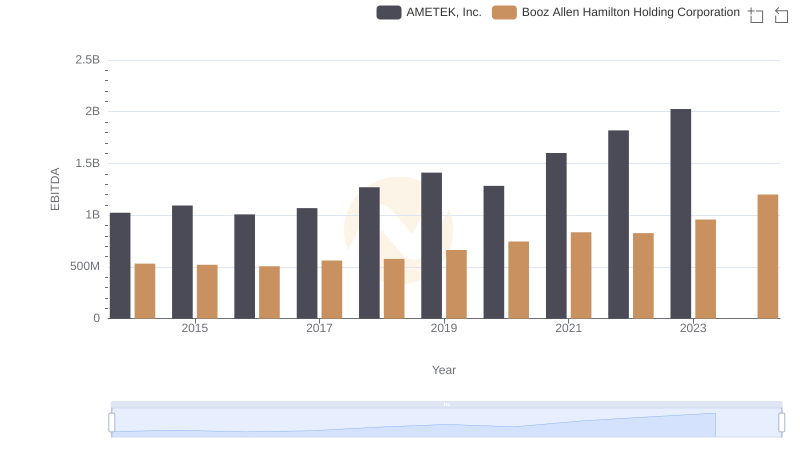
EBITDA Metrics Evaluated: AMETEK, Inc. vs Booz Allen Hamilton Holding Corporation
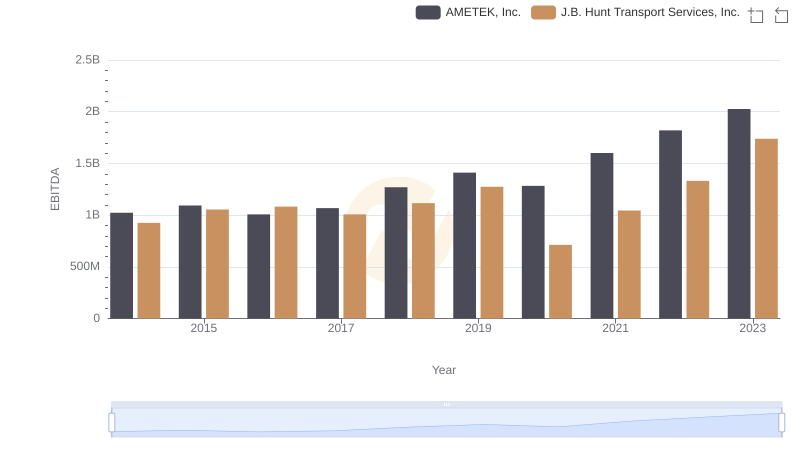
AMETEK, Inc. and J.B. Hunt Transport Services, Inc.: A Detailed Examination of EBITDA Performance
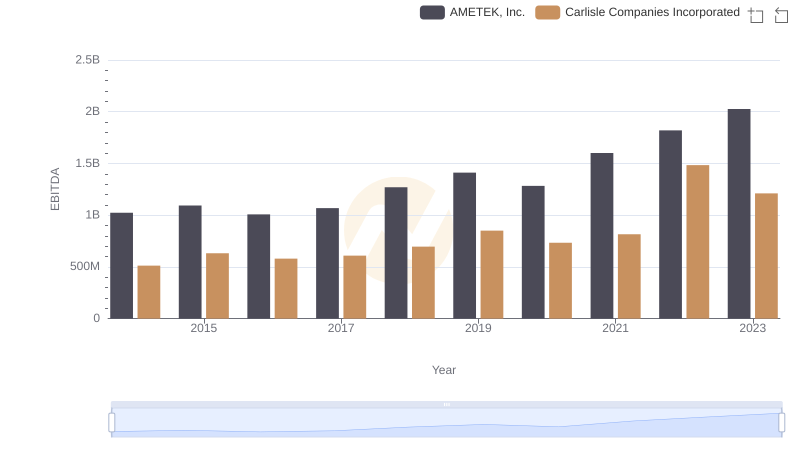
AMETEK, Inc. and Carlisle Companies Incorporated: A Detailed Examination of EBITDA Performance