| __timestamp | AMETEK, Inc. | AerCap Holdings N.V. |
|---|---|---|
| Wednesday, January 1, 2014 | 1023344000 | 2997442000 |
| Thursday, January 1, 2015 | 1093776000 | 4313510000 |
| Friday, January 1, 2016 | 1007213000 | 4101801000 |
| Sunday, January 1, 2017 | 1068174000 | 4061381000 |
| Monday, January 1, 2018 | 1269415000 | 2874193000 |
| Tuesday, January 1, 2019 | 1411422000 | 3157061000 |
| Wednesday, January 1, 2020 | 1283159000 | 4028661000 |
| Friday, January 1, 2021 | 1600782000 | 3192341000 |
| Saturday, January 1, 2022 | 1820119000 | 6911148000 |
| Sunday, January 1, 2023 | 2025843000 | 4547656000 |
| Monday, January 1, 2024 | 1779562000 |
Cracking the code
In the world of industrial manufacturing and aircraft leasing, AMETEK, Inc. and AerCap Holdings N.V. stand as titans. Over the past decade, their EBITDA performance has painted a fascinating picture of growth and resilience. From 2014 to 2023, AerCap Holdings N.V. consistently outperformed AMETEK, Inc., with an average EBITDA nearly three times higher. Notably, in 2022, AerCap's EBITDA surged to a remarkable 6.9 billion, marking a 117% increase from 2018. Meanwhile, AMETEK, Inc. demonstrated steady growth, achieving a 98% increase in EBITDA over the same period, peaking at 2 billion in 2023. This comparison highlights the dynamic nature of these industries, where strategic investments and market conditions play pivotal roles. As we look to the future, these companies' trajectories will undoubtedly continue to captivate investors and industry analysts alike.
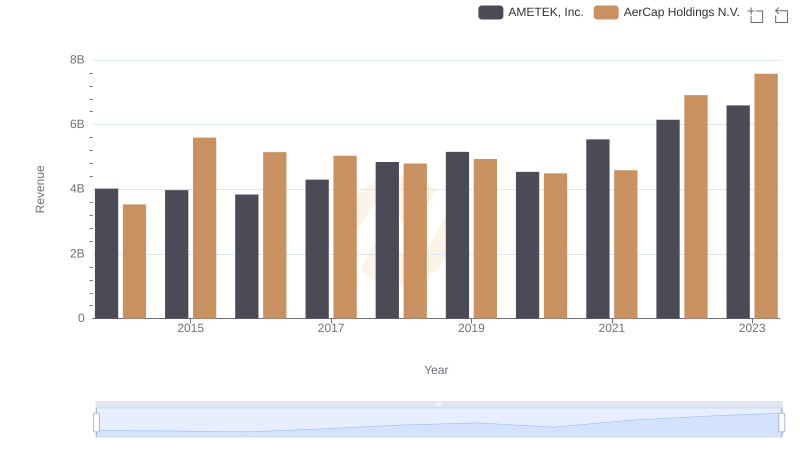
Annual Revenue Comparison: AMETEK, Inc. vs AerCap Holdings N.V.
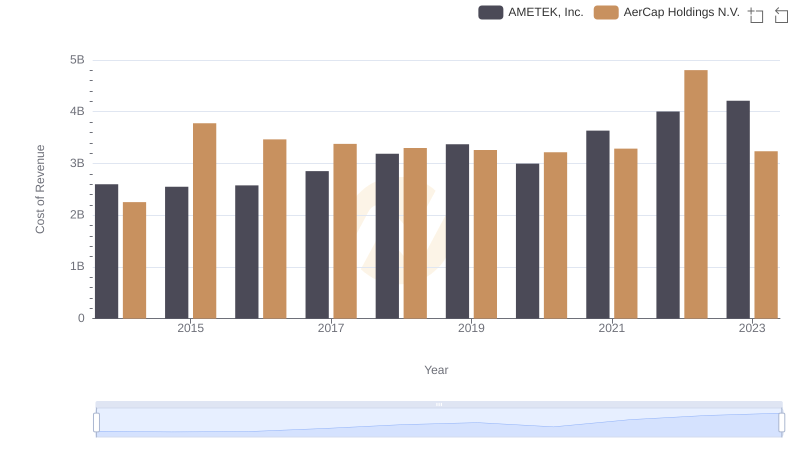
Cost of Revenue: Key Insights for AMETEK, Inc. and AerCap Holdings N.V.
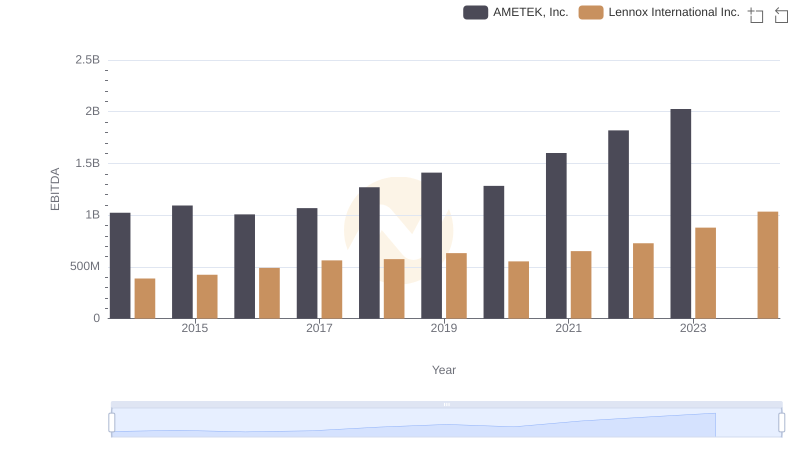
AMETEK, Inc. vs Lennox International Inc.: In-Depth EBITDA Performance Comparison
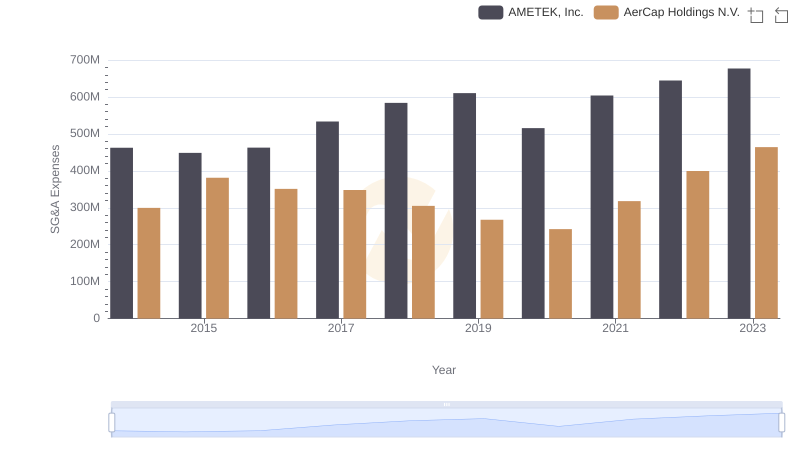
Selling, General, and Administrative Costs: AMETEK, Inc. vs AerCap Holdings N.V.
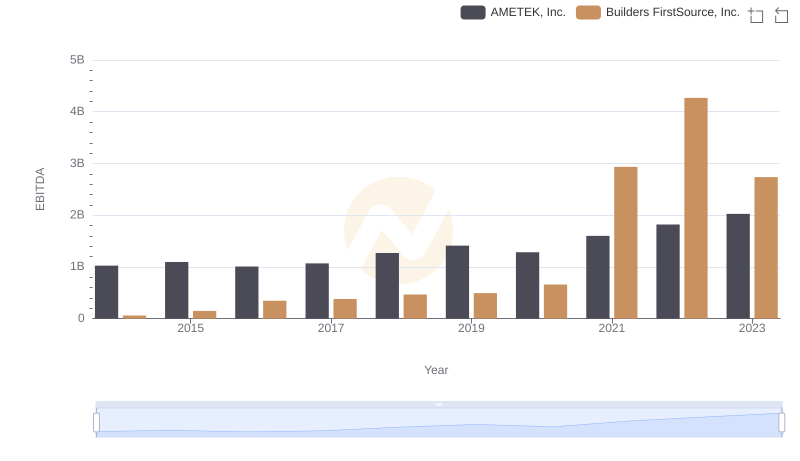
EBITDA Metrics Evaluated: AMETEK, Inc. vs Builders FirstSource, Inc.
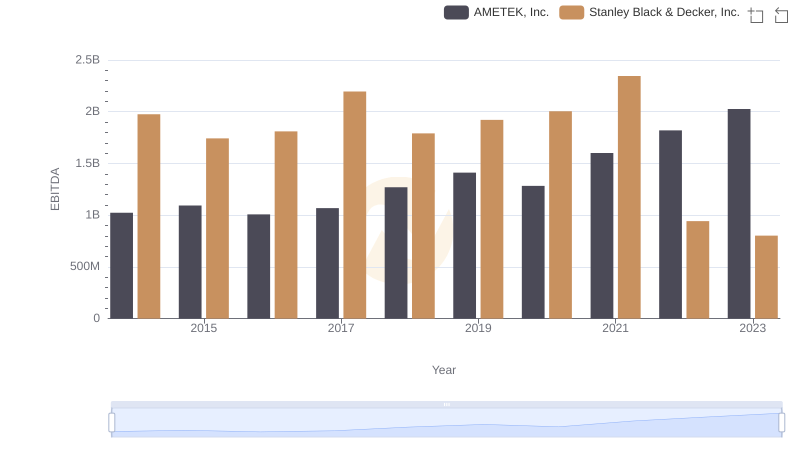
Comparative EBITDA Analysis: AMETEK, Inc. vs Stanley Black & Decker, Inc.
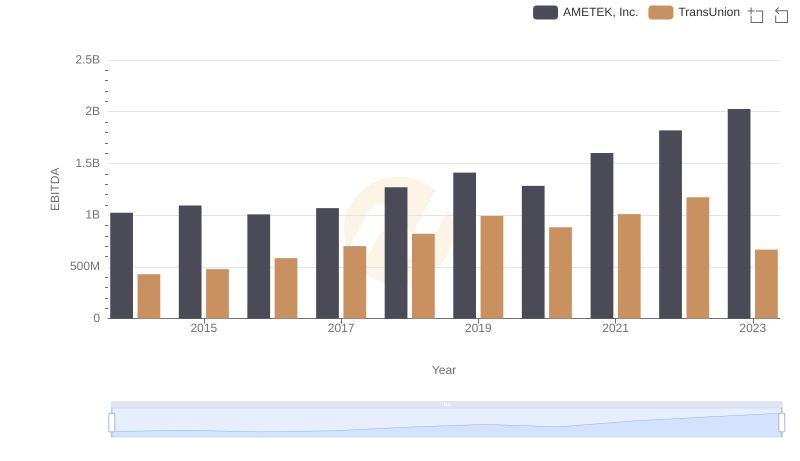
A Professional Review of EBITDA: AMETEK, Inc. Compared to TransUnion
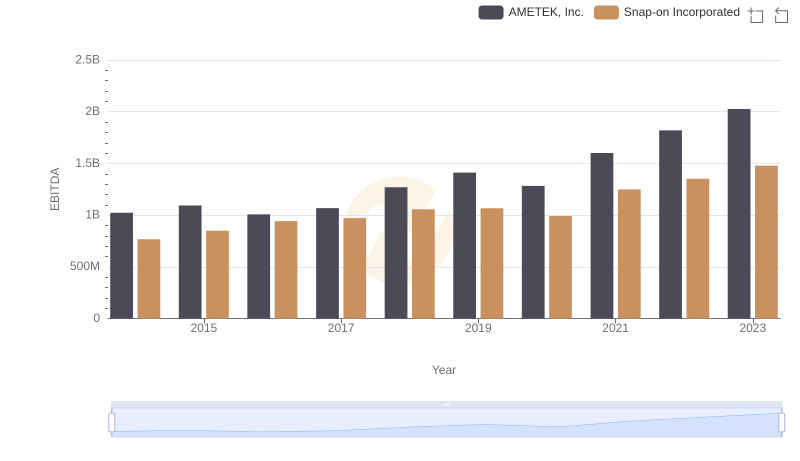
A Side-by-Side Analysis of EBITDA: AMETEK, Inc. and Snap-on Incorporated