| __timestamp | AMETEK, Inc. | Booz Allen Hamilton Holding Corporation |
|---|---|---|
| Wednesday, January 1, 2014 | 2597017000 | 2716113000 |
| Thursday, January 1, 2015 | 2549280000 | 2593849000 |
| Friday, January 1, 2016 | 2575220000 | 2580026000 |
| Sunday, January 1, 2017 | 2851431000 | 2691982000 |
| Monday, January 1, 2018 | 3186310000 | 2867103000 |
| Tuesday, January 1, 2019 | 3370897000 | 3100466000 |
| Wednesday, January 1, 2020 | 2996515000 | 3379180000 |
| Friday, January 1, 2021 | 3633900000 | 3657530000 |
| Saturday, January 1, 2022 | 4005261000 | 3899622000 |
| Sunday, January 1, 2023 | 4212484999 | 4304810000 |
| Monday, January 1, 2024 | 0 | 8202847000 |
Cracking the code
In the ever-evolving landscape of corporate finance, understanding cost structures is pivotal. Over the past decade, AMETEK, Inc. and Booz Allen Hamilton Holding Corporation have showcased intriguing trends in their cost of revenue. From 2014 to 2023, AMETEK's cost of revenue grew by approximately 62%, peaking at $4.21 billion in 2023. Meanwhile, Booz Allen Hamilton's costs surged by nearly 59%, reaching $4.30 billion in the same year. Notably, Booz Allen Hamilton's cost of revenue in 2024 is projected to skyrocket to $8.20 billion, a significant leap that demands attention. This data highlights the strategic financial maneuvers these companies have undertaken to navigate market challenges. As we delve into these figures, it becomes evident that both companies are adapting to the dynamic economic environment, albeit with distinct approaches.
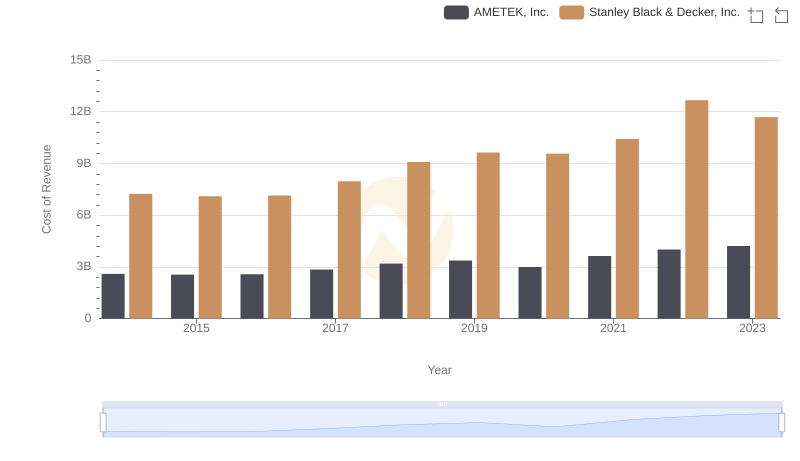
Comparing Cost of Revenue Efficiency: AMETEK, Inc. vs Stanley Black & Decker, Inc.
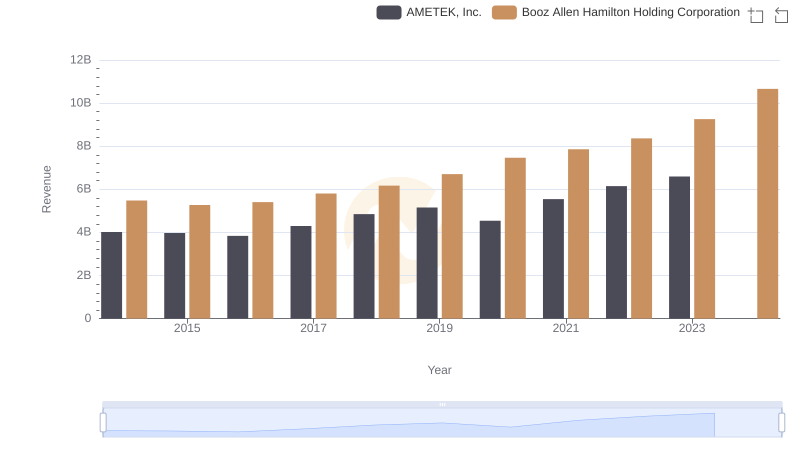
AMETEK, Inc. vs Booz Allen Hamilton Holding Corporation: Examining Key Revenue Metrics
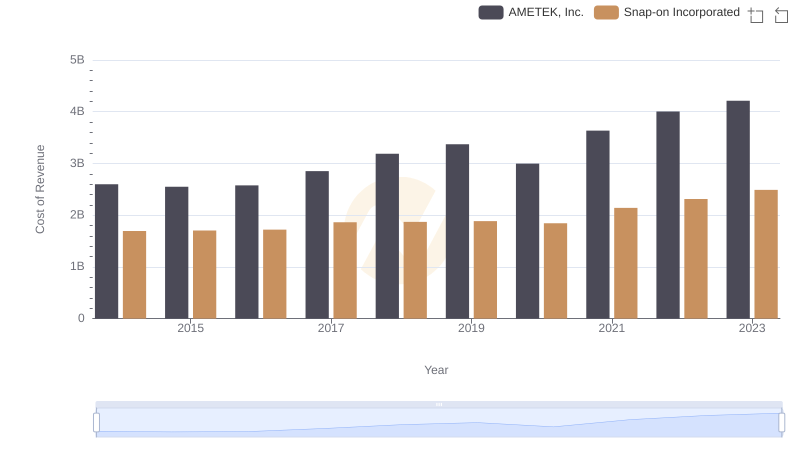
Cost of Revenue Trends: AMETEK, Inc. vs Snap-on Incorporated
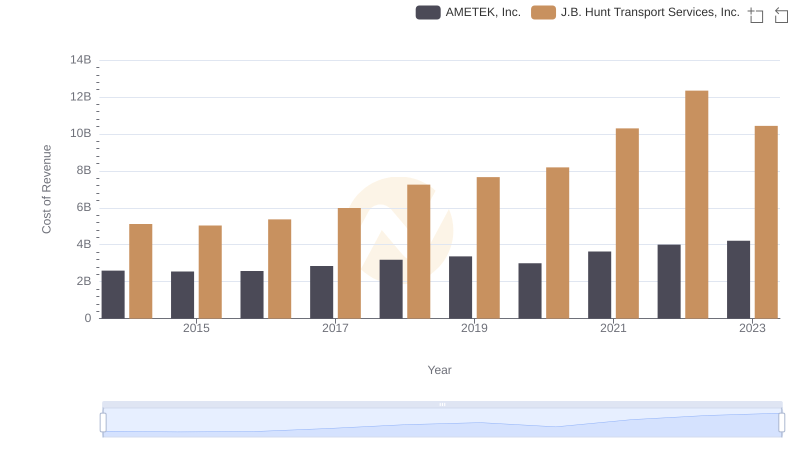
Cost of Revenue Trends: AMETEK, Inc. vs J.B. Hunt Transport Services, Inc.
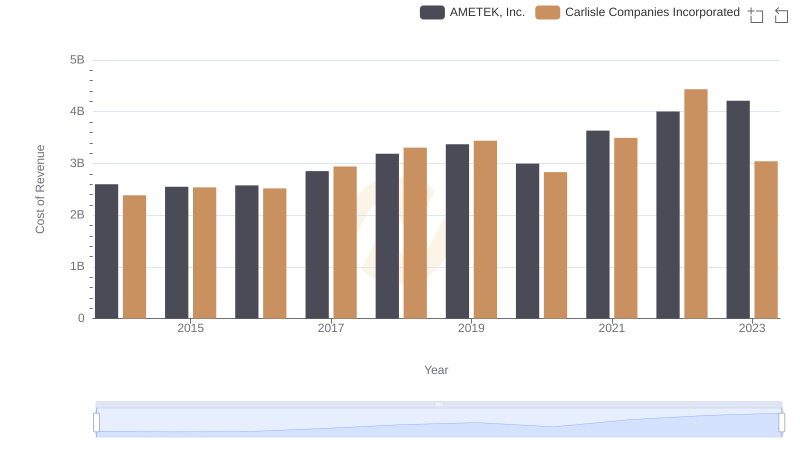
Cost of Revenue Comparison: AMETEK, Inc. vs Carlisle Companies Incorporated
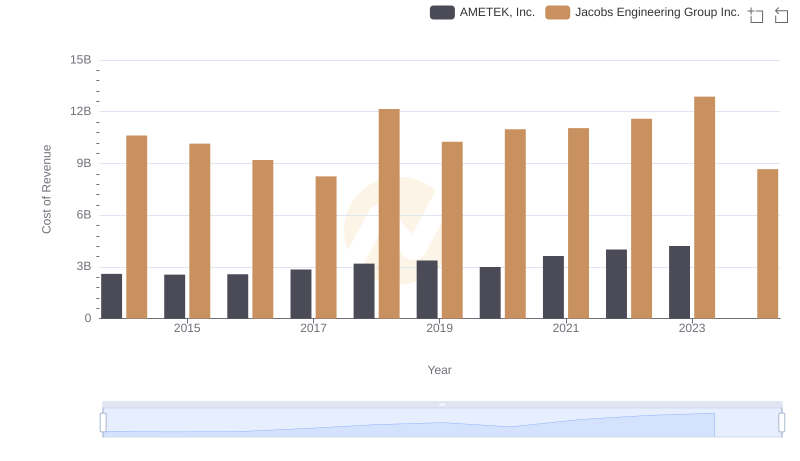
AMETEK, Inc. vs Jacobs Engineering Group Inc.: Efficiency in Cost of Revenue Explored
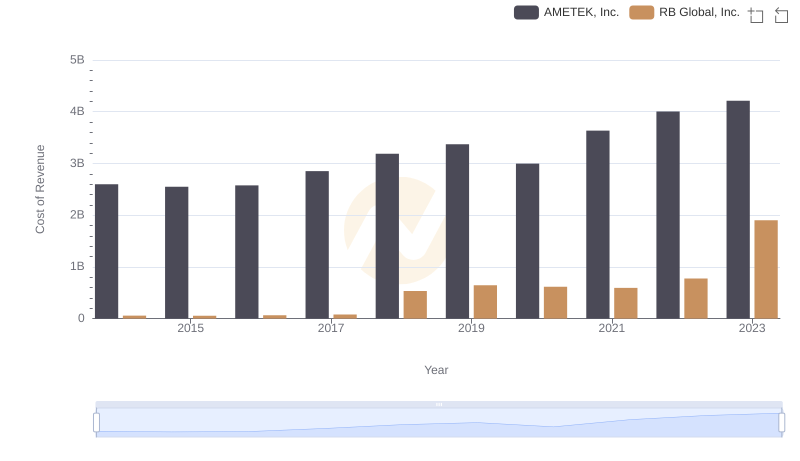
AMETEK, Inc. vs RB Global, Inc.: Efficiency in Cost of Revenue Explored
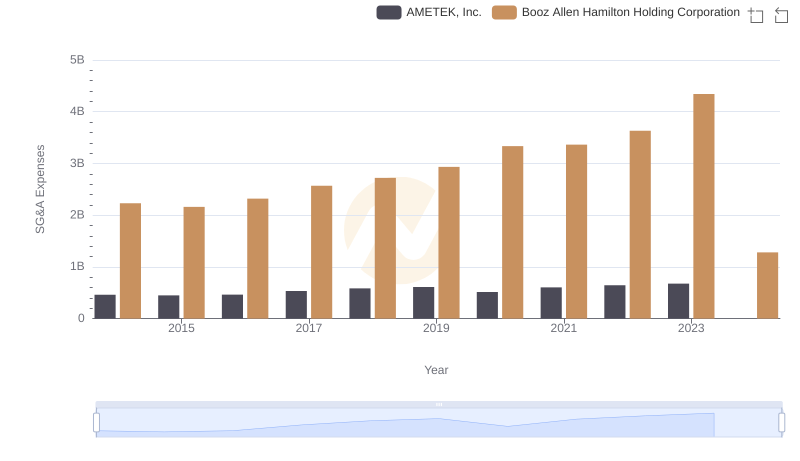
AMETEK, Inc. or Booz Allen Hamilton Holding Corporation: Who Manages SG&A Costs Better?
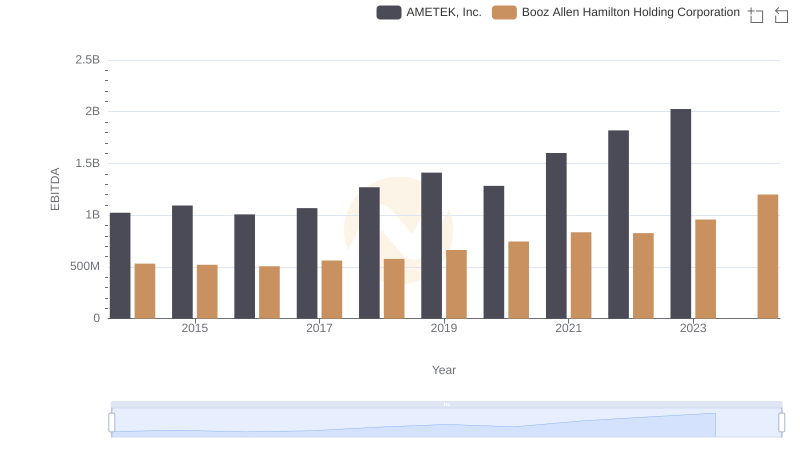
EBITDA Metrics Evaluated: AMETEK, Inc. vs Booz Allen Hamilton Holding Corporation