| __timestamp | AMETEK, Inc. | J.B. Hunt Transport Services, Inc. |
|---|---|---|
| Wednesday, January 1, 2014 | 1023344000 | 926038000 |
| Thursday, January 1, 2015 | 1093776000 | 1055307000 |
| Friday, January 1, 2016 | 1007213000 | 1082601000 |
| Sunday, January 1, 2017 | 1068174000 | 1007307000 |
| Monday, January 1, 2018 | 1269415000 | 1116914000 |
| Tuesday, January 1, 2019 | 1411422000 | 1274241000 |
| Wednesday, January 1, 2020 | 1283159000 | 713119000 |
| Friday, January 1, 2021 | 1600782000 | 1045530000 |
| Saturday, January 1, 2022 | 1820119000 | 1331553000 |
| Sunday, January 1, 2023 | 2025843000 | 1738774000 |
| Monday, January 1, 2024 | 1779562000 |
Infusing magic into the data realm
In the ever-evolving landscape of American industry, AMETEK, Inc. and J.B. Hunt Transport Services, Inc. stand as titans in their respective fields. Over the past decade, both companies have demonstrated remarkable EBITDA growth, a key indicator of financial health and operational efficiency. From 2014 to 2023, AMETEK's EBITDA surged by approximately 98%, reflecting its robust expansion and strategic acquisitions. Meanwhile, J.B. Hunt's EBITDA grew by around 88%, underscoring its resilience and adaptability in the logistics sector.
The year 2023 marked a pinnacle for both companies, with AMETEK achieving an EBITDA of over $2 billion, while J.B. Hunt reached nearly $1.74 billion. This growth trajectory highlights their ability to navigate economic challenges and capitalize on market opportunities. As we delve deeper into their financial journeys, these figures offer a compelling narrative of success and strategic foresight.
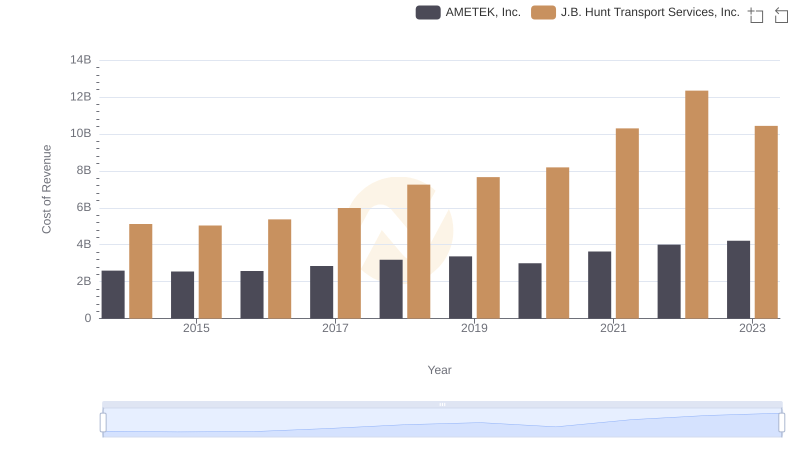
Cost of Revenue Trends: AMETEK, Inc. vs J.B. Hunt Transport Services, Inc.
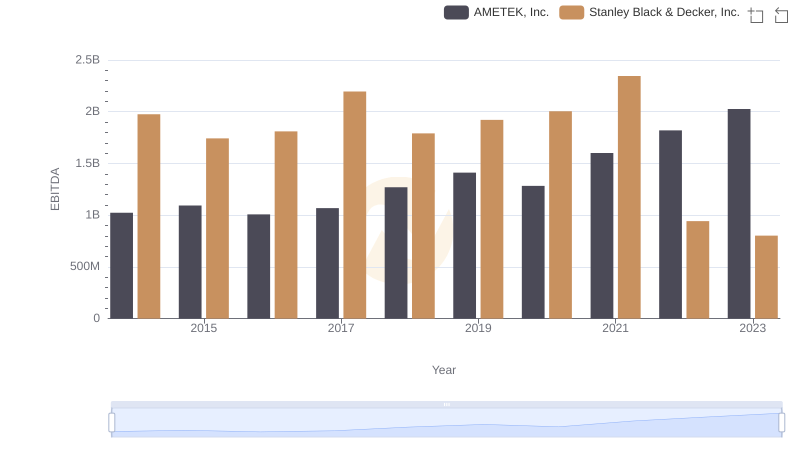
Comparative EBITDA Analysis: AMETEK, Inc. vs Stanley Black & Decker, Inc.
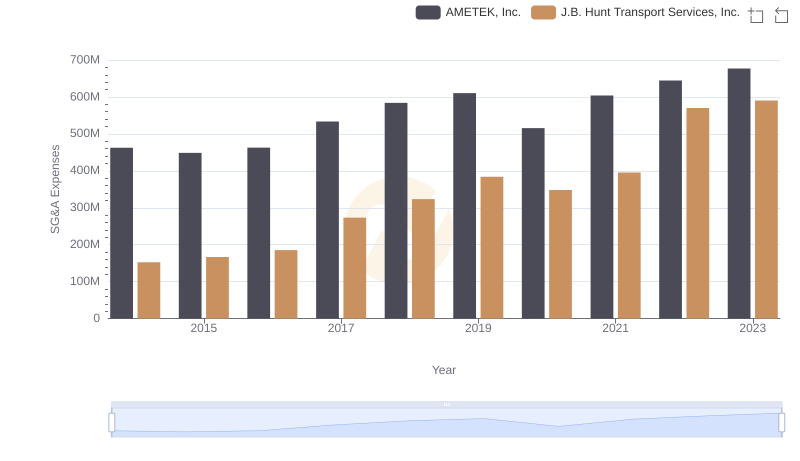
AMETEK, Inc. and J.B. Hunt Transport Services, Inc.: SG&A Spending Patterns Compared
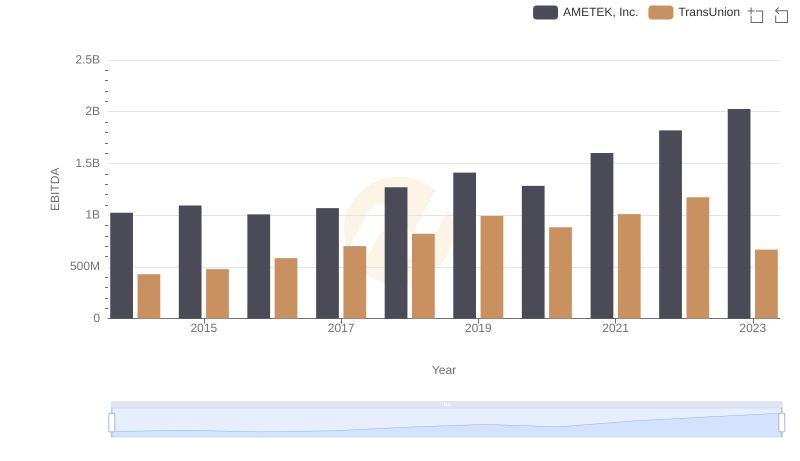
A Professional Review of EBITDA: AMETEK, Inc. Compared to TransUnion
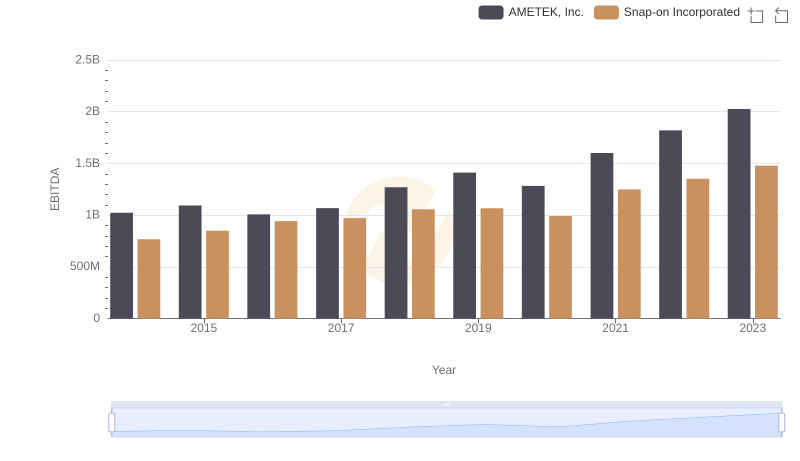
A Side-by-Side Analysis of EBITDA: AMETEK, Inc. and Snap-on Incorporated
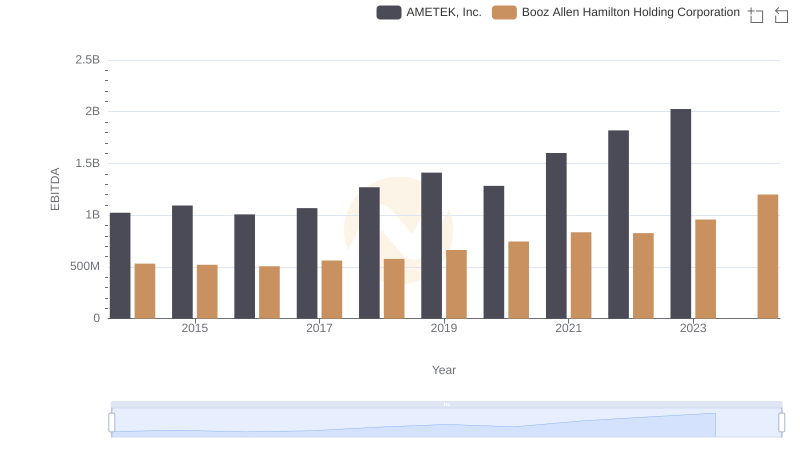
EBITDA Metrics Evaluated: AMETEK, Inc. vs Booz Allen Hamilton Holding Corporation
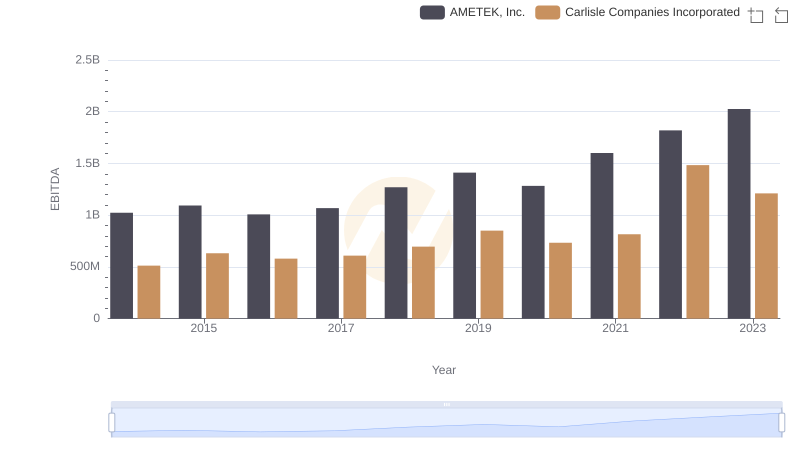
AMETEK, Inc. and Carlisle Companies Incorporated: A Detailed Examination of EBITDA Performance
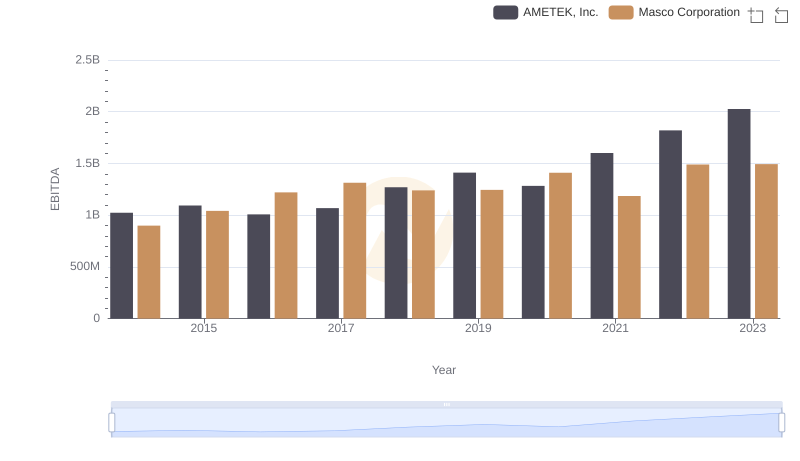
EBITDA Metrics Evaluated: AMETEK, Inc. vs Masco Corporation
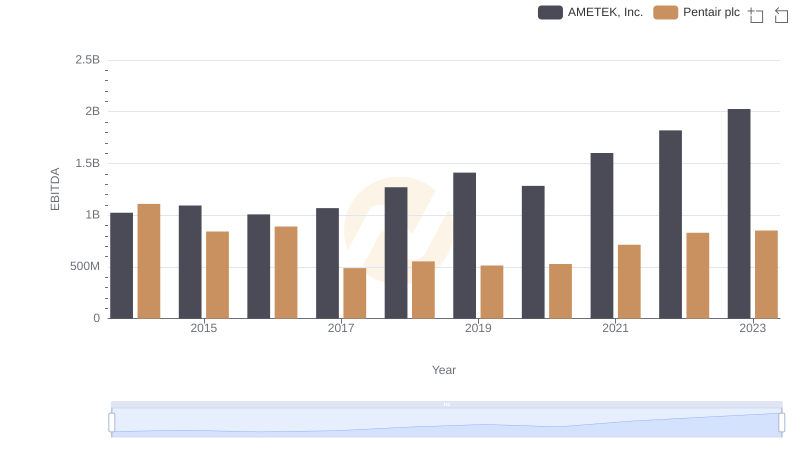
A Professional Review of EBITDA: AMETEK, Inc. Compared to Pentair plc
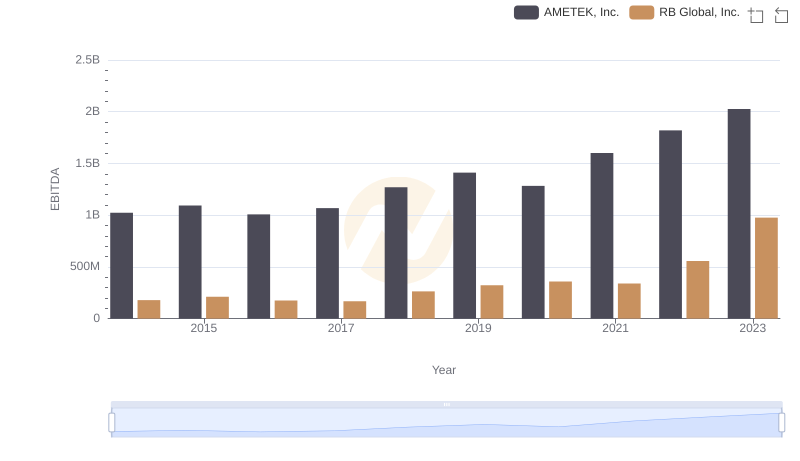
A Professional Review of EBITDA: AMETEK, Inc. Compared to RB Global, Inc.