| __timestamp | Jacobs Engineering Group Inc. | Waste Management, Inc. |
|---|---|---|
| Wednesday, January 1, 2014 | 699015000 | 3509000000 |
| Thursday, January 1, 2015 | 598932000 | 3342000000 |
| Friday, January 1, 2016 | 431954000 | 3713000000 |
| Sunday, January 1, 2017 | 527765000 | 3996000000 |
| Monday, January 1, 2018 | 606328000 | 4212000000 |
| Tuesday, January 1, 2019 | 604075000 | 4344000000 |
| Wednesday, January 1, 2020 | 685042000 | 4149000000 |
| Friday, January 1, 2021 | 1019116000 | 4956000000 |
| Saturday, January 1, 2022 | 1277649000 | 5466000000 |
| Sunday, January 1, 2023 | 1392039000 | 5592000000 |
| Monday, January 1, 2024 | 1255083000 | 5128000000 |
In pursuit of knowledge
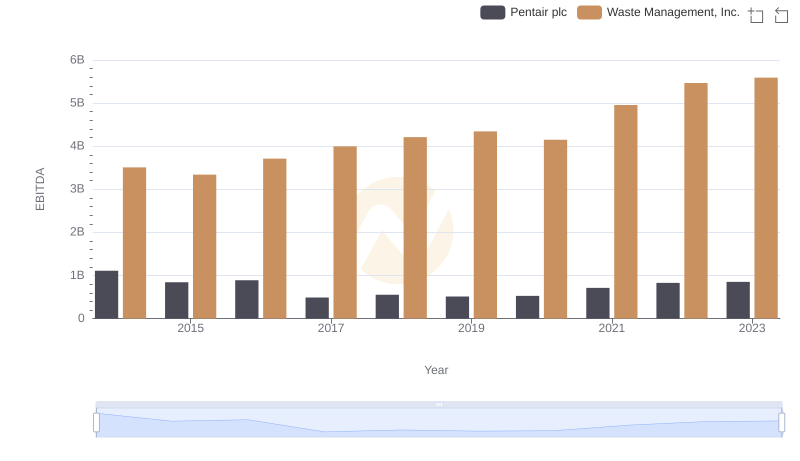
In the ever-evolving landscape of environmental services and engineering, Waste Management, Inc. and Jacobs Engineering Group Inc. have emerged as industry titans. Over the past decade, Waste Management has consistently outperformed Jacobs Engineering in terms of EBITDA, showcasing a robust growth trajectory. From 2014 to 2023, Waste Management's EBITDA surged by approximately 60%, peaking in 2023. In contrast, Jacobs Engineering experienced a more modest growth of around 99% over the same period, with a notable spike in 2021. This divergence highlights Waste Management's strategic prowess in capitalizing on the increasing demand for sustainable waste solutions. However, Jacobs Engineering's recent uptick suggests a promising pivot towards innovative engineering solutions. As we look to the future, the missing data for 2024 leaves room for speculation on how these giants will continue to navigate the challenges and opportunities in their respective fields.
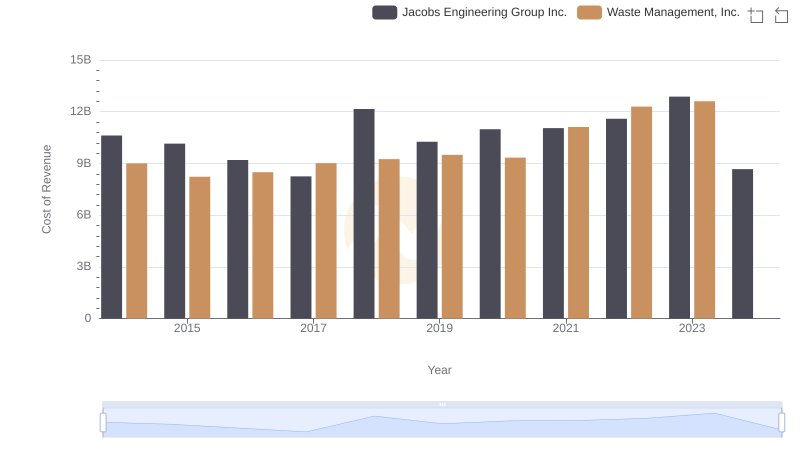
Cost of Revenue: Key Insights for Waste Management, Inc. and Jacobs Engineering Group Inc.
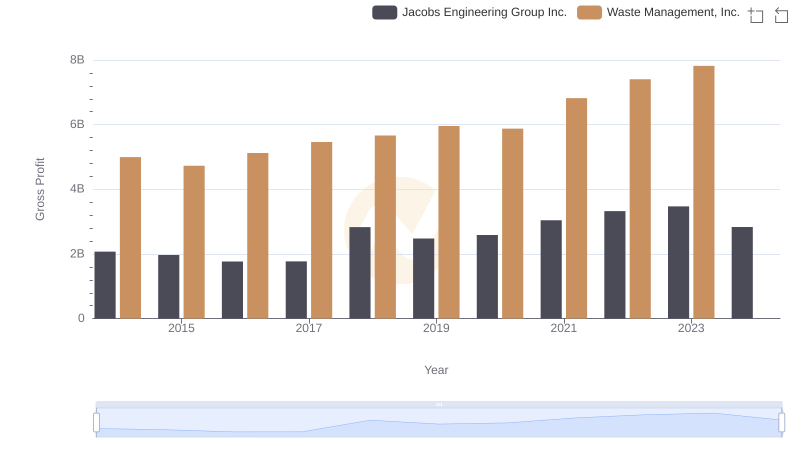
Waste Management, Inc. and Jacobs Engineering Group Inc.: A Detailed Gross Profit Analysis
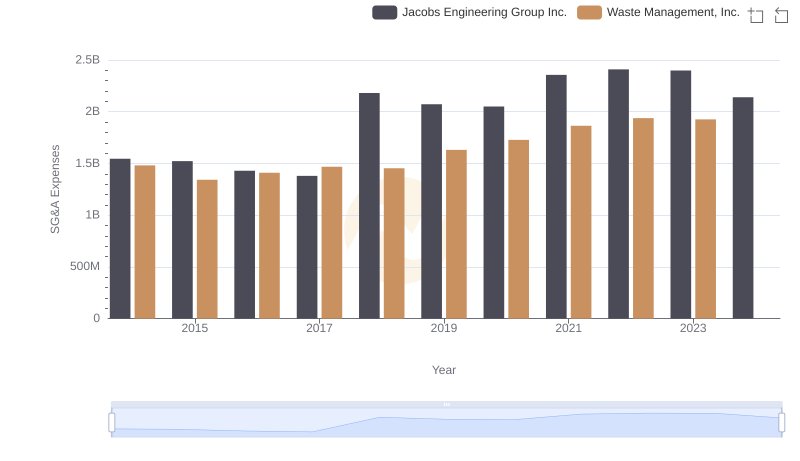
Cost Management Insights: SG&A Expenses for Waste Management, Inc. and Jacobs Engineering Group Inc.
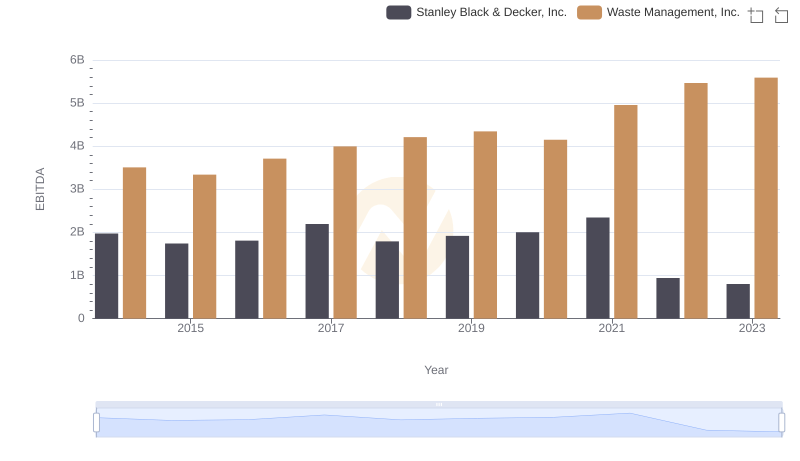
EBITDA Metrics Evaluated: Waste Management, Inc. vs Stanley Black & Decker, Inc.
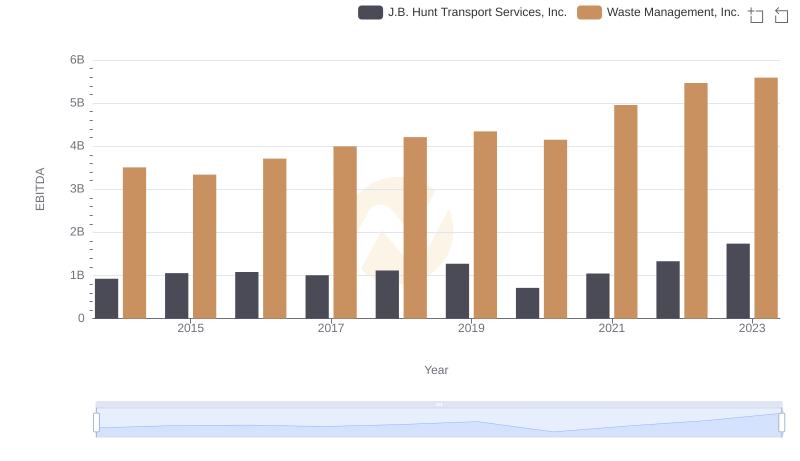
EBITDA Performance Review: Waste Management, Inc. vs J.B. Hunt Transport Services, Inc.
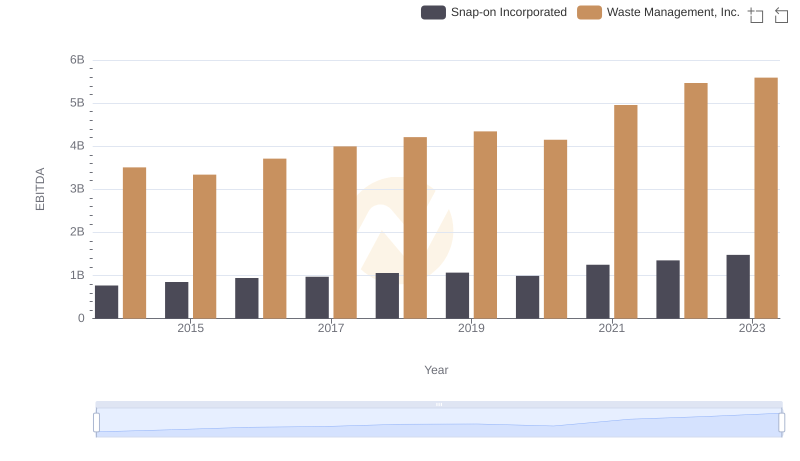
Professional EBITDA Benchmarking: Waste Management, Inc. vs Snap-on Incorporated
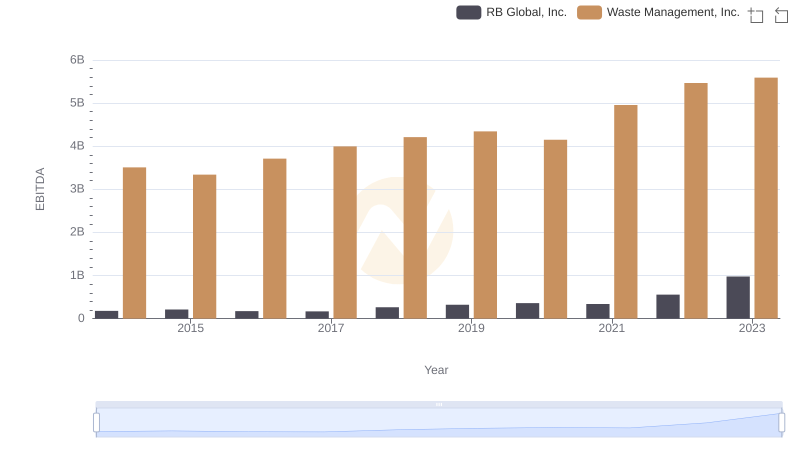
Waste Management, Inc. vs RB Global, Inc.: In-Depth EBITDA Performance Comparison
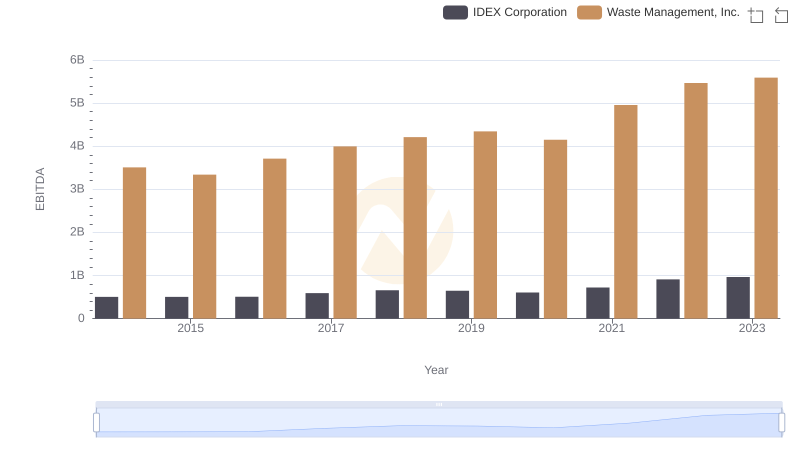
Professional EBITDA Benchmarking: Waste Management, Inc. vs IDEX Corporation
EBITDA Metrics Evaluated: Waste Management, Inc. vs Pentair plc