| __timestamp | Snap-on Incorporated | Waste Management, Inc. |
|---|---|---|
| Wednesday, January 1, 2014 | 767600000 | 3509000000 |
| Thursday, January 1, 2015 | 848900000 | 3342000000 |
| Friday, January 1, 2016 | 942400000 | 3713000000 |
| Sunday, January 1, 2017 | 971900000 | 3996000000 |
| Monday, January 1, 2018 | 1057400000 | 4212000000 |
| Tuesday, January 1, 2019 | 1067000000 | 4344000000 |
| Wednesday, January 1, 2020 | 991400000 | 4149000000 |
| Friday, January 1, 2021 | 1249100000 | 4956000000 |
| Saturday, January 1, 2022 | 1351500000 | 5466000000 |
| Sunday, January 1, 2023 | 1478800000 | 5592000000 |
| Monday, January 1, 2024 | 1520700000 | 5128000000 |
Cracking the code
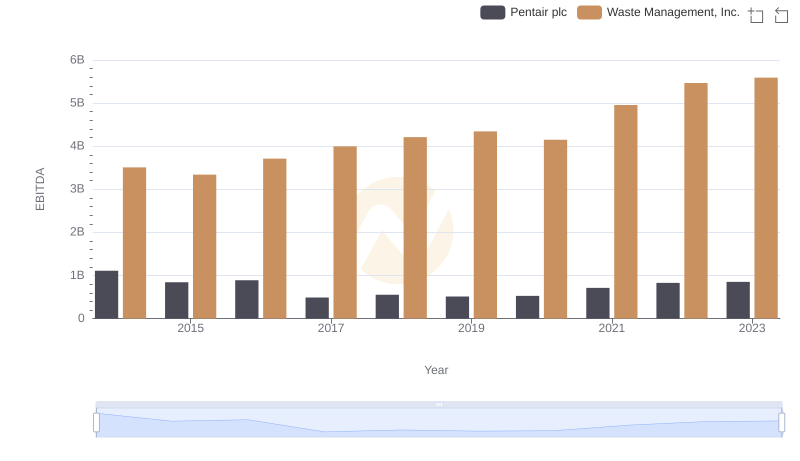
In the ever-evolving landscape of corporate finance, EBITDA serves as a crucial metric for evaluating a company's operational performance. Over the past decade, Waste Management, Inc. and Snap-on Incorporated have demonstrated remarkable growth in this area. From 2014 to 2023, Waste Management's EBITDA surged by approximately 59%, reaching a peak in 2023. This growth underscores the company's robust operational efficiency and strategic investments in sustainable waste solutions.
Meanwhile, Snap-on Incorporated, a leader in professional tools and equipment, saw its EBITDA increase by nearly 93% over the same period. This impressive growth reflects Snap-on's commitment to innovation and customer-centric solutions. By 2023, Snap-on's EBITDA had nearly doubled from its 2014 levels, showcasing its resilience in a competitive market.
These trends highlight the dynamic nature of these industries and the strategic prowess of these companies in navigating economic challenges.
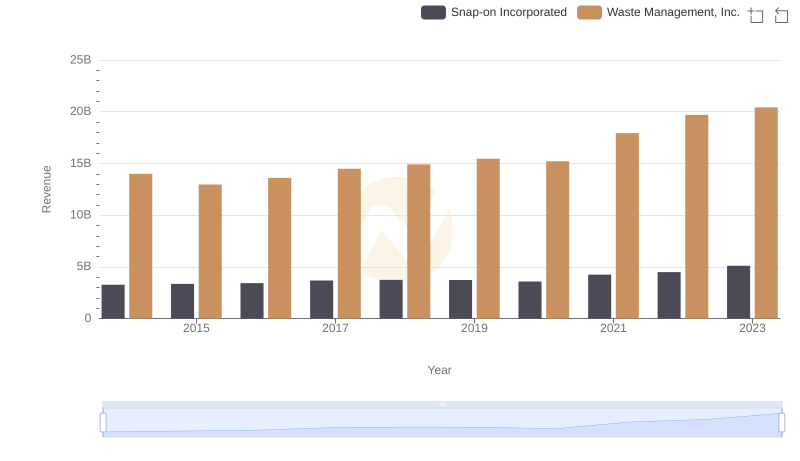
Waste Management, Inc. and Snap-on Incorporated: A Comprehensive Revenue Analysis
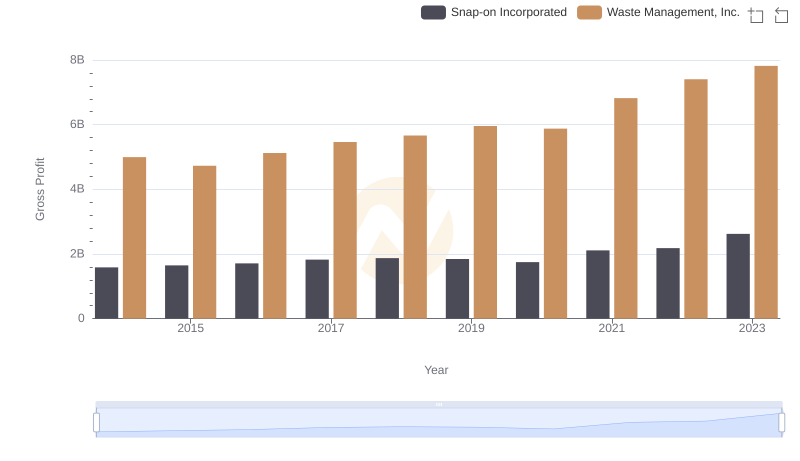
Waste Management, Inc. and Snap-on Incorporated: A Detailed Gross Profit Analysis
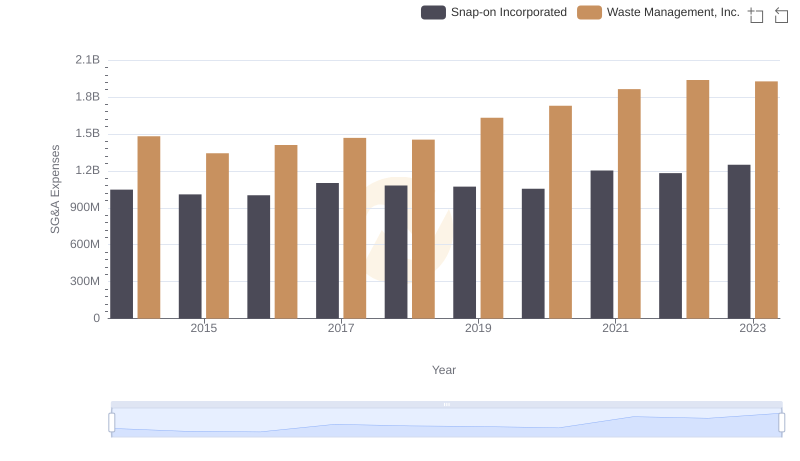
Operational Costs Compared: SG&A Analysis of Waste Management, Inc. and Snap-on Incorporated
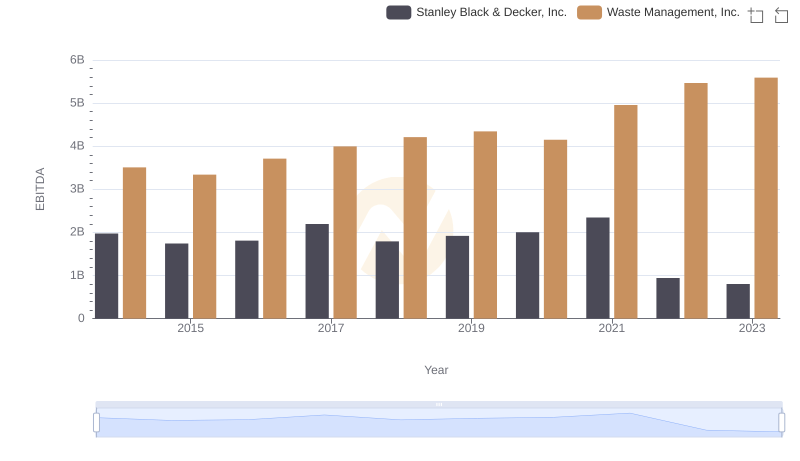
EBITDA Metrics Evaluated: Waste Management, Inc. vs Stanley Black & Decker, Inc.
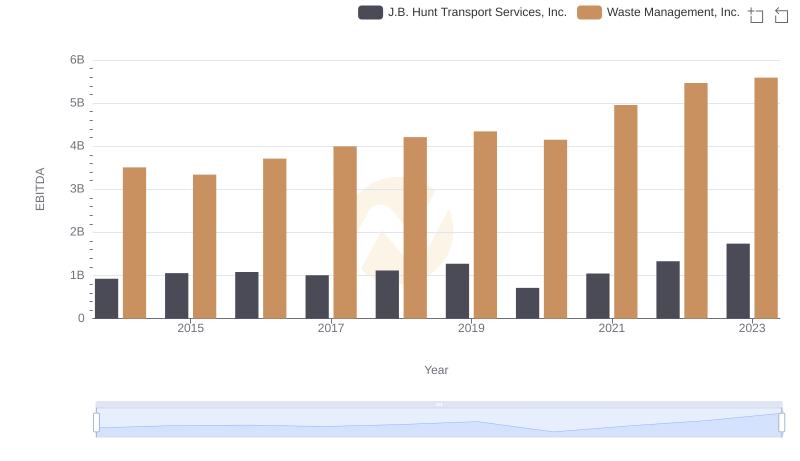
EBITDA Performance Review: Waste Management, Inc. vs J.B. Hunt Transport Services, Inc.
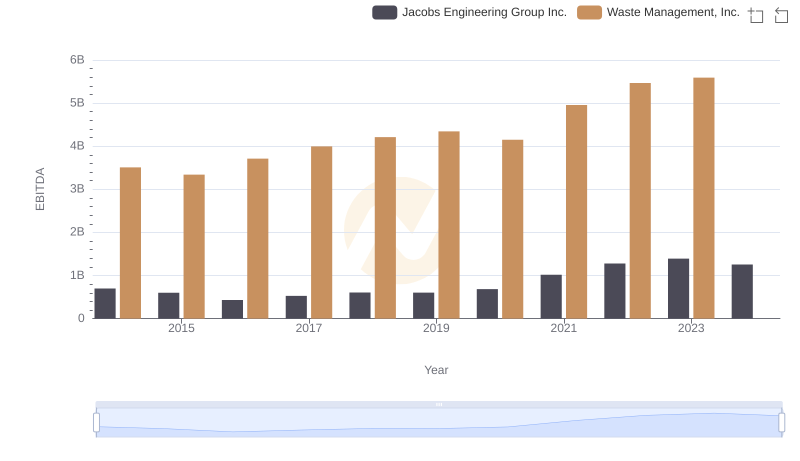
Comparative EBITDA Analysis: Waste Management, Inc. vs Jacobs Engineering Group Inc.
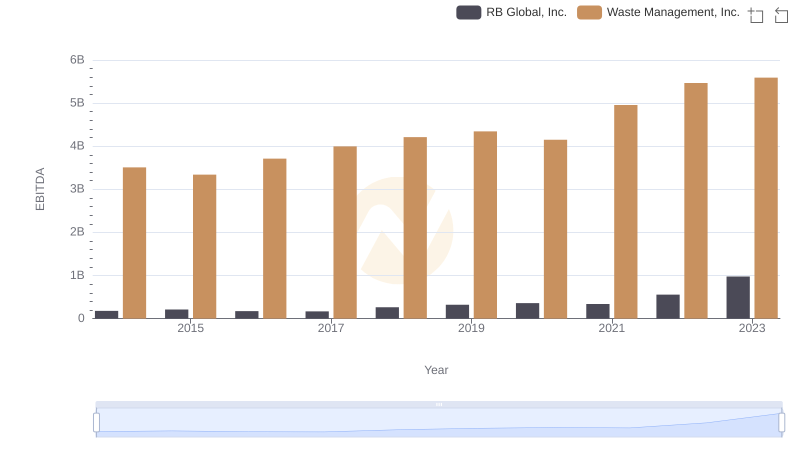
Waste Management, Inc. vs RB Global, Inc.: In-Depth EBITDA Performance Comparison
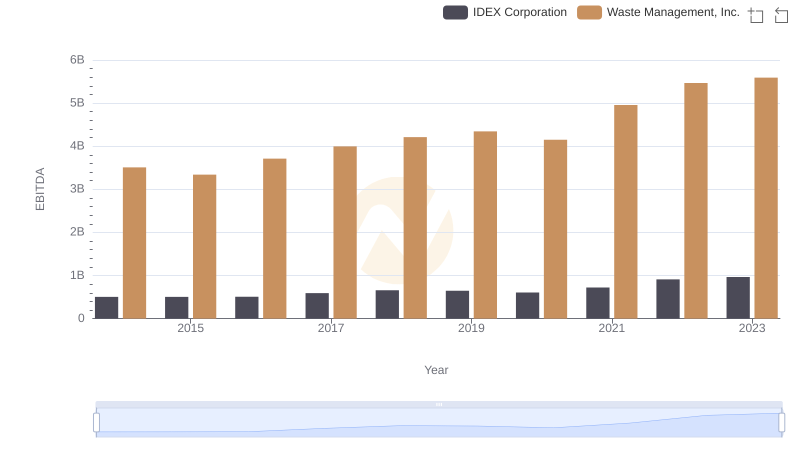
Professional EBITDA Benchmarking: Waste Management, Inc. vs IDEX Corporation
EBITDA Metrics Evaluated: Waste Management, Inc. vs Pentair plc