| __timestamp | RB Global, Inc. | Waste Management, Inc. |
|---|---|---|
| Wednesday, January 1, 2014 | 178851000 | 3509000000 |
| Thursday, January 1, 2015 | 211417000 | 3342000000 |
| Friday, January 1, 2016 | 174791291 | 3713000000 |
| Sunday, January 1, 2017 | 168379000 | 3996000000 |
| Monday, January 1, 2018 | 263653000 | 4212000000 |
| Tuesday, January 1, 2019 | 322140110 | 4344000000 |
| Wednesday, January 1, 2020 | 358617000 | 4149000000 |
| Friday, January 1, 2021 | 339928424 | 4956000000 |
| Saturday, January 1, 2022 | 557399151 | 5466000000 |
| Sunday, January 1, 2023 | 975874087 | 5592000000 |
| Monday, January 1, 2024 | 761100000 | 5128000000 |
In pursuit of knowledge
In the ever-evolving landscape of waste management and global asset solutions, Waste Management, Inc. and RB Global, Inc. have emerged as industry titans. Over the past decade, Waste Management, Inc. has consistently outperformed RB Global, Inc. in terms of EBITDA, showcasing a robust growth trajectory. From 2014 to 2023, Waste Management, Inc. saw its EBITDA grow by approximately 60%, peaking in 2023. In contrast, RB Global, Inc. experienced a more volatile journey, with a significant surge in 2023, marking a 450% increase from its 2014 figures. This comparison highlights Waste Management, Inc.'s steady financial health and RB Global, Inc.'s recent aggressive growth strategy. As the industry continues to adapt to environmental challenges and economic shifts, these companies' financial performances offer valuable insights into their strategic directions and market positions.
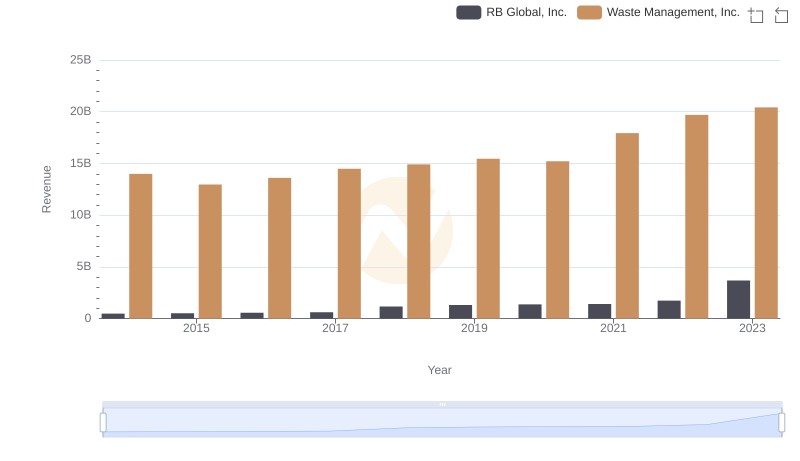
Revenue Showdown: Waste Management, Inc. vs RB Global, Inc.
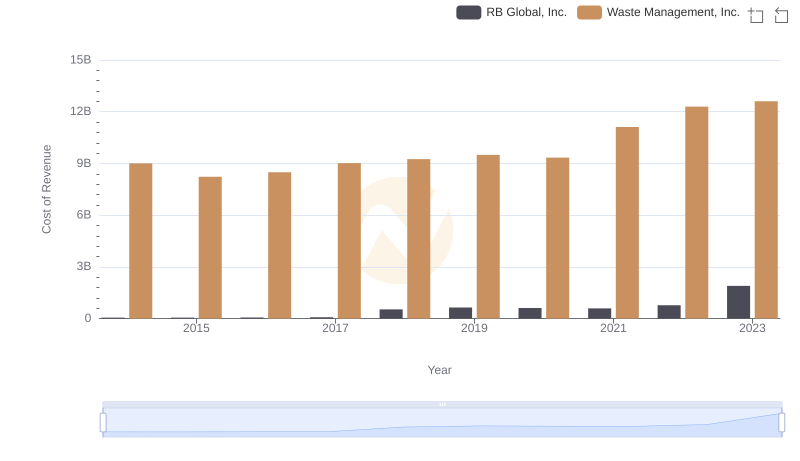
Cost of Revenue: Key Insights for Waste Management, Inc. and RB Global, Inc.
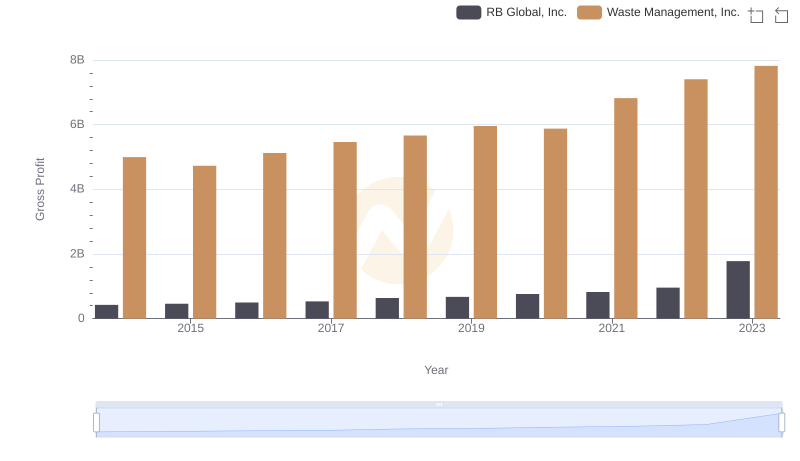
Gross Profit Comparison: Waste Management, Inc. and RB Global, Inc. Trends
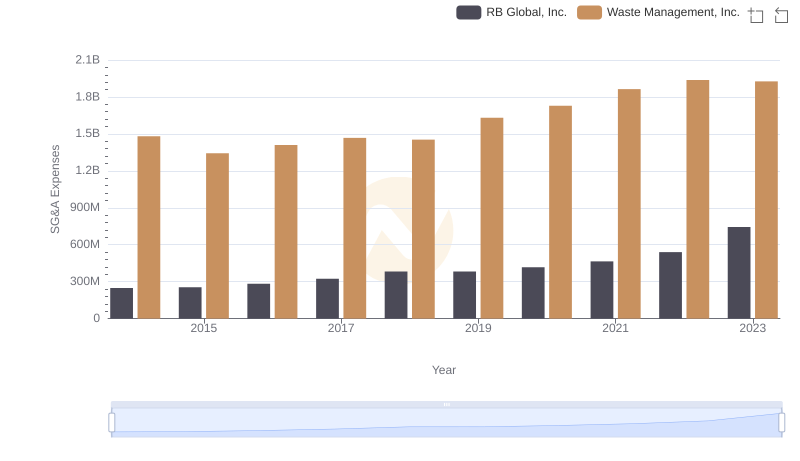
Cost Management Insights: SG&A Expenses for Waste Management, Inc. and RB Global, Inc.
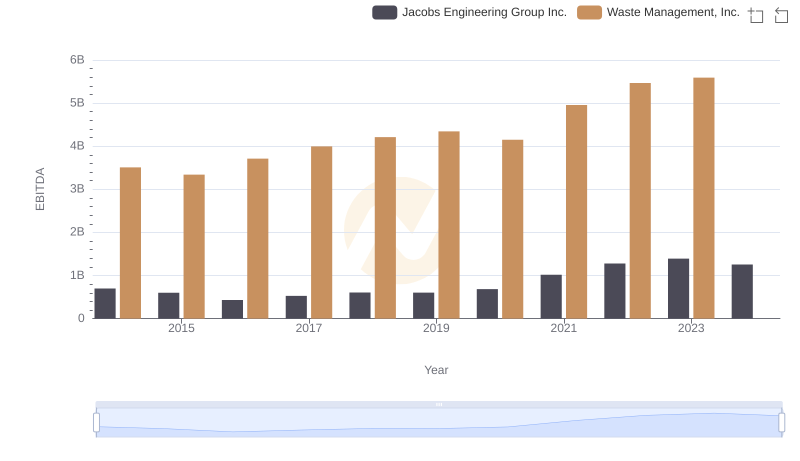
Comparative EBITDA Analysis: Waste Management, Inc. vs Jacobs Engineering Group Inc.
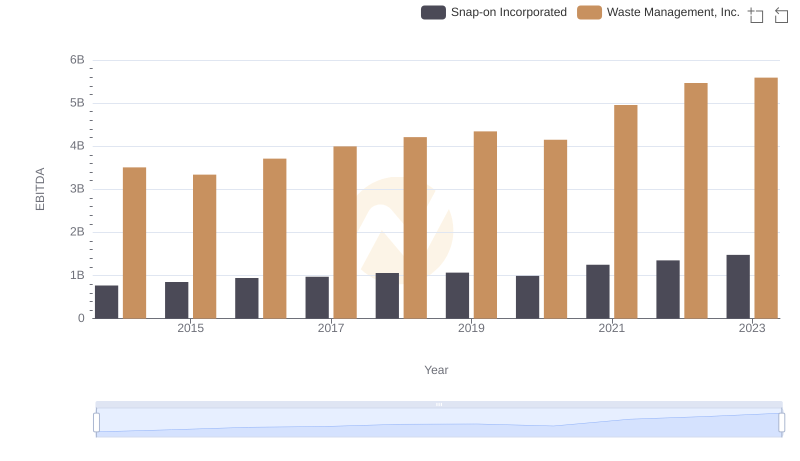
Professional EBITDA Benchmarking: Waste Management, Inc. vs Snap-on Incorporated
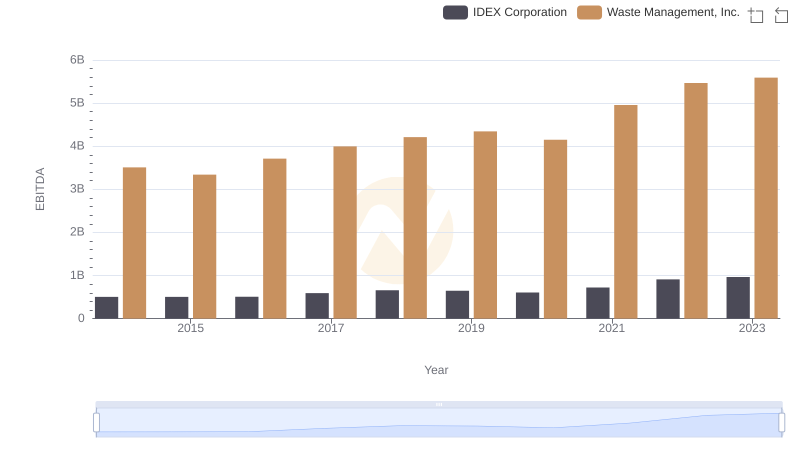
Professional EBITDA Benchmarking: Waste Management, Inc. vs IDEX Corporation
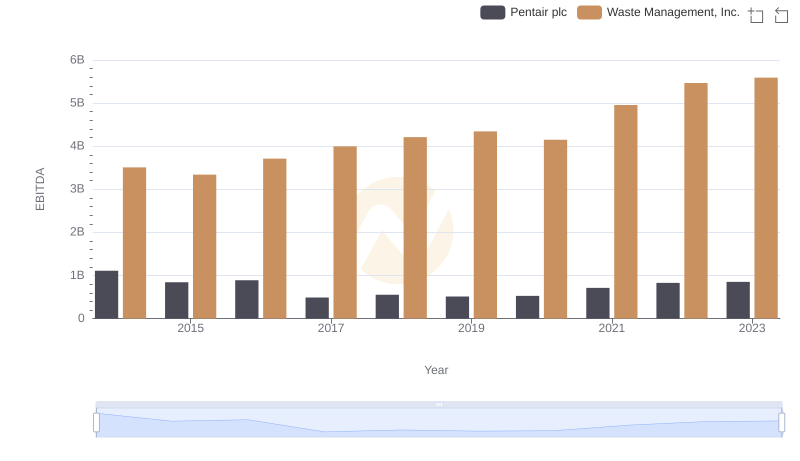
EBITDA Metrics Evaluated: Waste Management, Inc. vs Pentair plc
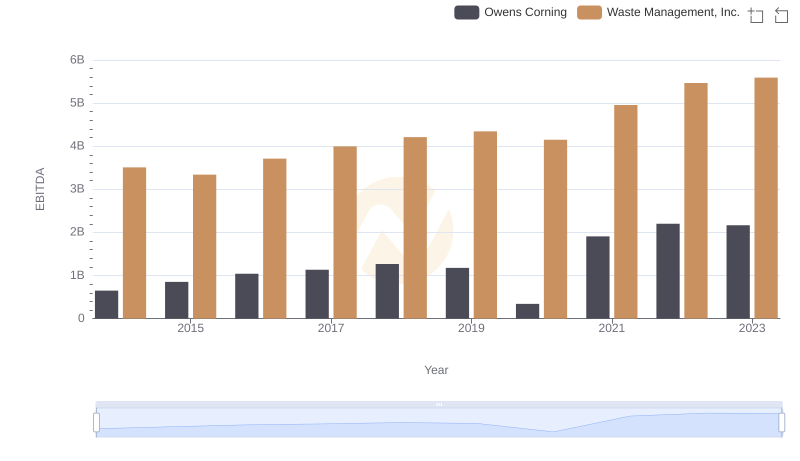
A Side-by-Side Analysis of EBITDA: Waste Management, Inc. and Owens Corning
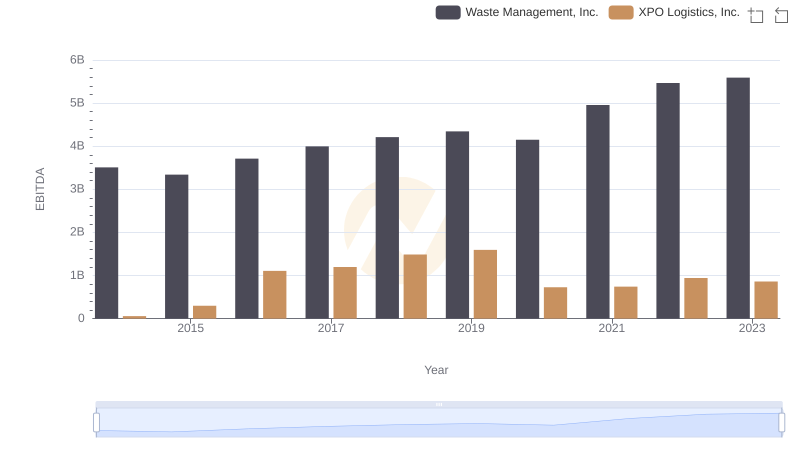
EBITDA Analysis: Evaluating Waste Management, Inc. Against XPO Logistics, Inc.