| __timestamp | Owens Corning | Waste Management, Inc. |
|---|---|---|
| Wednesday, January 1, 2014 | 650000000 | 3509000000 |
| Thursday, January 1, 2015 | 853000000 | 3342000000 |
| Friday, January 1, 2016 | 1041000000 | 3713000000 |
| Sunday, January 1, 2017 | 1134000000 | 3996000000 |
| Monday, January 1, 2018 | 1266000000 | 4212000000 |
| Tuesday, January 1, 2019 | 1178000000 | 4344000000 |
| Wednesday, January 1, 2020 | 341000000 | 4149000000 |
| Friday, January 1, 2021 | 1909000000 | 4956000000 |
| Saturday, January 1, 2022 | 2200000000 | 5466000000 |
| Sunday, January 1, 2023 | 2166000000 | 5592000000 |
| Monday, January 1, 2024 | 5128000000 |
Unleashing insights
In the ever-evolving landscape of American industry, Waste Management, Inc. and Owens Corning stand as titans in their respective fields. Over the past decade, these companies have demonstrated remarkable resilience and growth, as evidenced by their EBITDA performance from 2014 to 2023. Waste Management, Inc., a leader in environmental services, has seen its EBITDA grow by approximately 60%, reaching a peak in 2023. Meanwhile, Owens Corning, a key player in the building materials sector, has experienced a staggering 233% increase in EBITDA over the same period.
This side-by-side analysis reveals not only the financial health of these companies but also their strategic adaptability in a competitive market. As Waste Management, Inc. continues to capitalize on sustainability trends, and Owens Corning leverages innovation in construction materials, their financial trajectories offer valuable insights into the future of their industries.
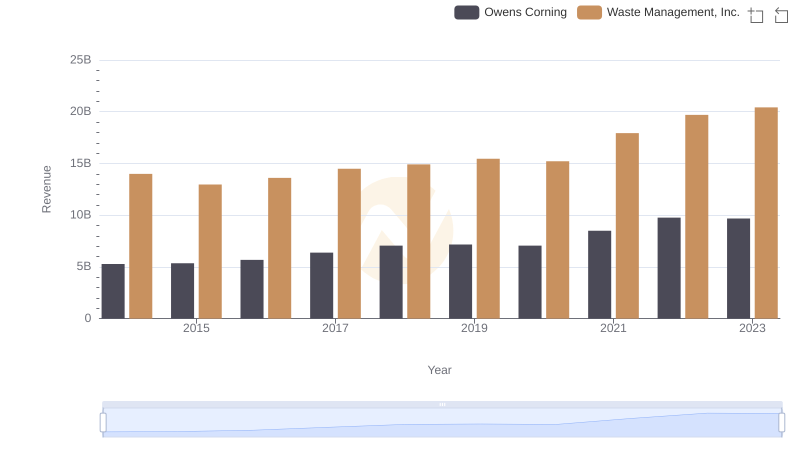
Revenue Insights: Waste Management, Inc. and Owens Corning Performance Compared
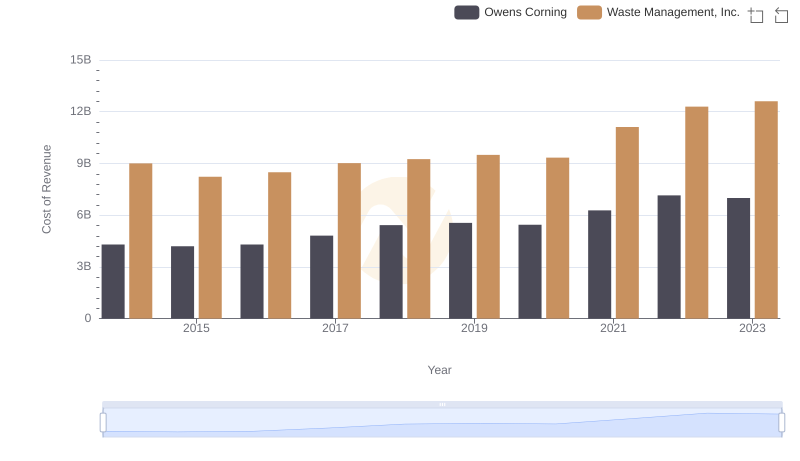
Comparing Cost of Revenue Efficiency: Waste Management, Inc. vs Owens Corning
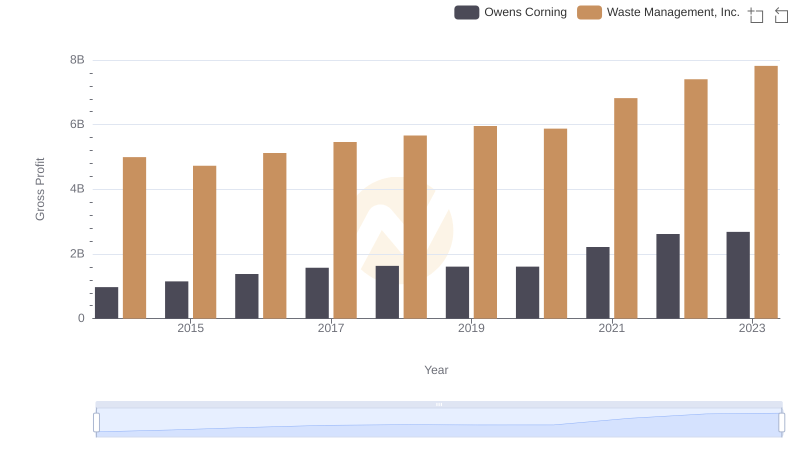
Key Insights on Gross Profit: Waste Management, Inc. vs Owens Corning
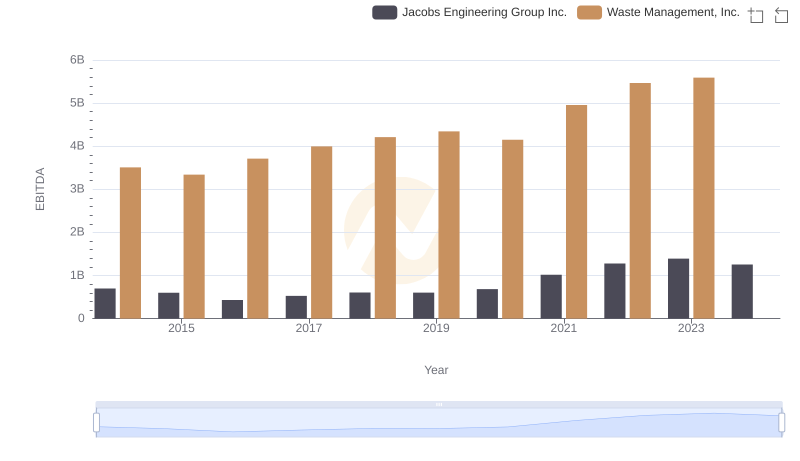
Comparative EBITDA Analysis: Waste Management, Inc. vs Jacobs Engineering Group Inc.
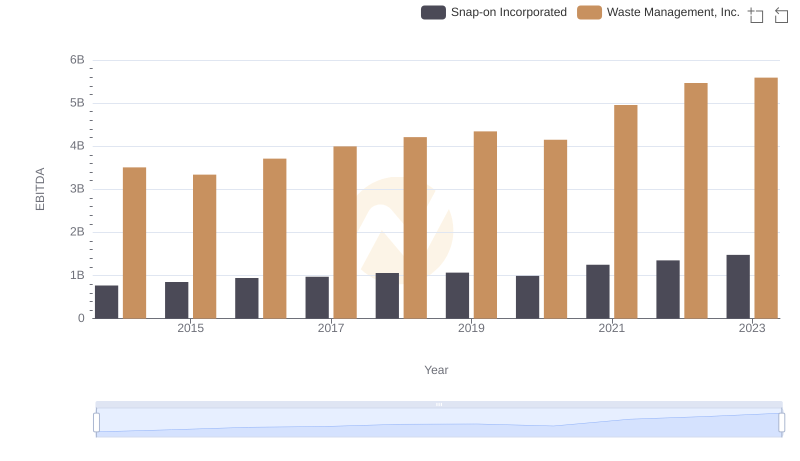
Professional EBITDA Benchmarking: Waste Management, Inc. vs Snap-on Incorporated
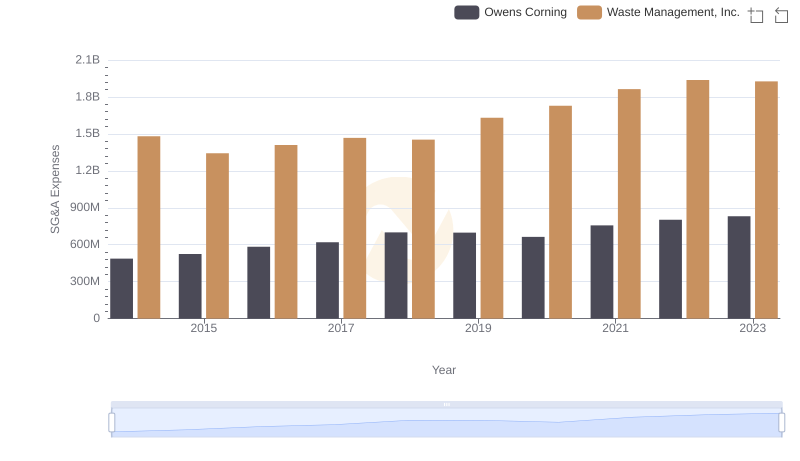
Selling, General, and Administrative Costs: Waste Management, Inc. vs Owens Corning
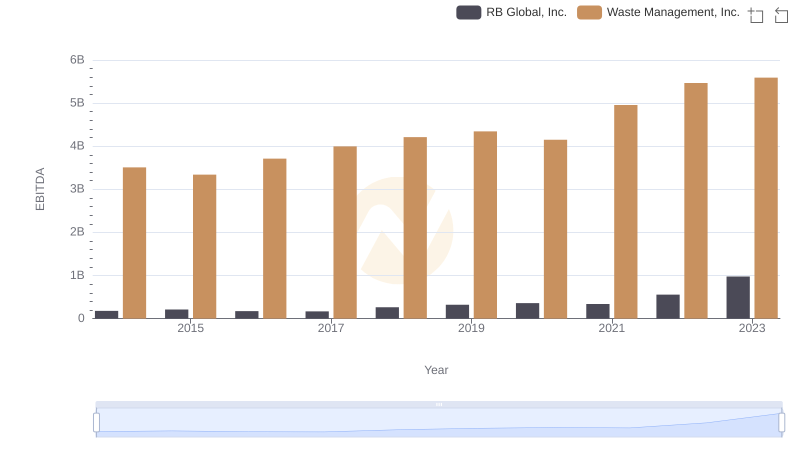
Waste Management, Inc. vs RB Global, Inc.: In-Depth EBITDA Performance Comparison
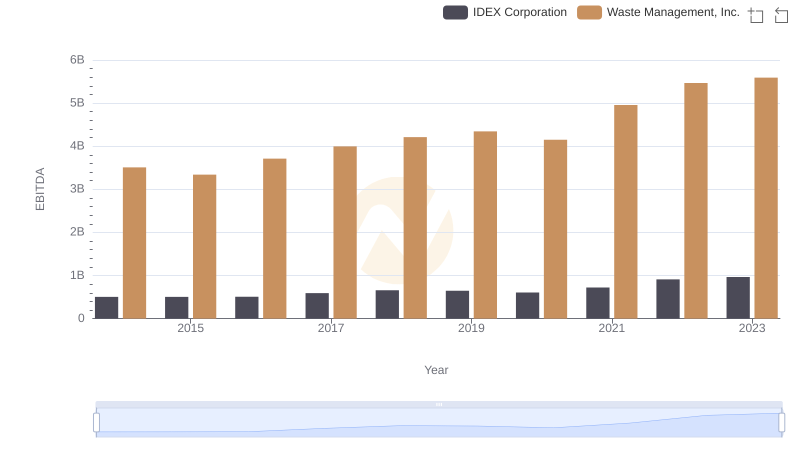
Professional EBITDA Benchmarking: Waste Management, Inc. vs IDEX Corporation
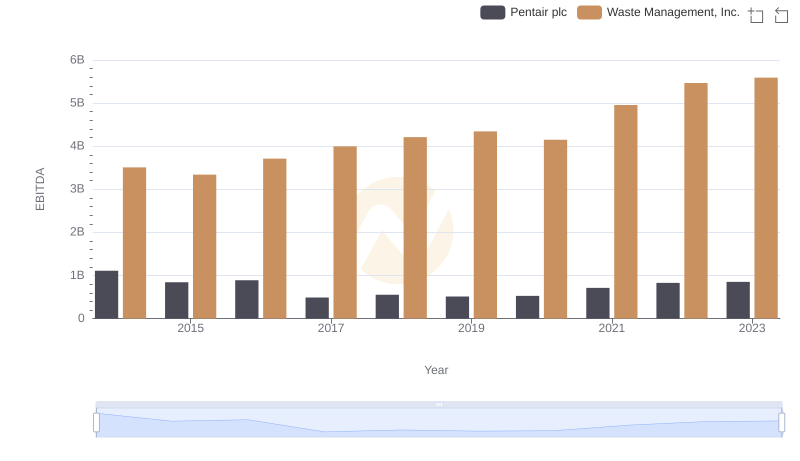
EBITDA Metrics Evaluated: Waste Management, Inc. vs Pentair plc
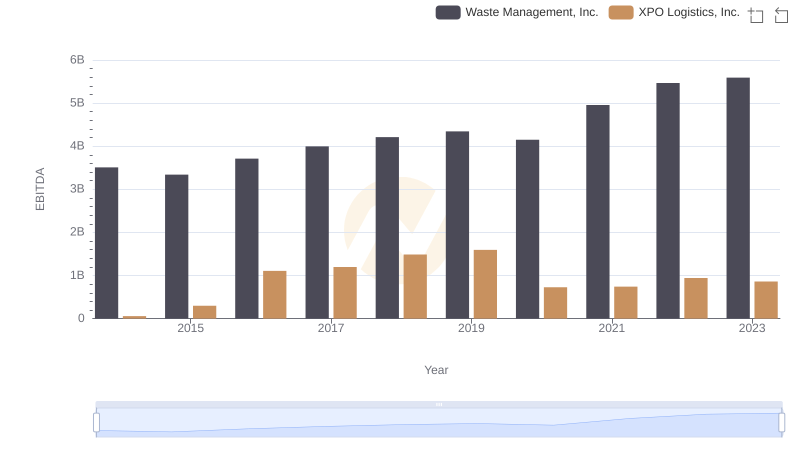
EBITDA Analysis: Evaluating Waste Management, Inc. Against XPO Logistics, Inc.
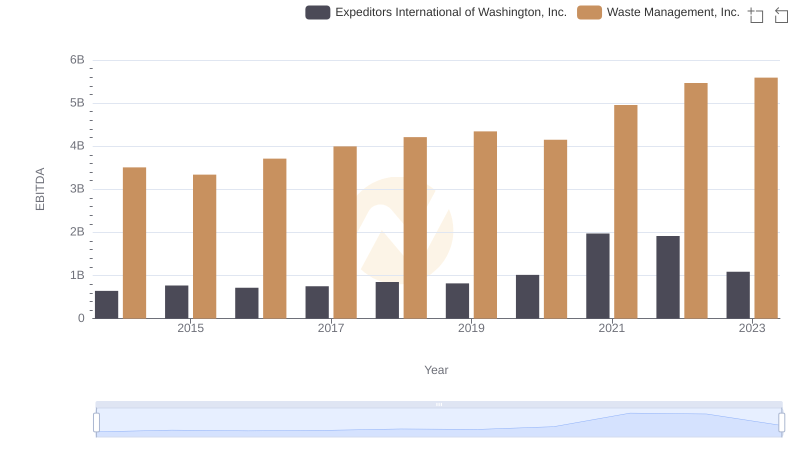
A Professional Review of EBITDA: Waste Management, Inc. Compared to Expeditors International of Washington, Inc.