| __timestamp | Expeditors International of Washington, Inc. | Waste Management, Inc. |
|---|---|---|
| Wednesday, January 1, 2014 | 643940000 | 3509000000 |
| Thursday, January 1, 2015 | 767496000 | 3342000000 |
| Friday, January 1, 2016 | 716959000 | 3713000000 |
| Sunday, January 1, 2017 | 749570000 | 3996000000 |
| Monday, January 1, 2018 | 850582000 | 4212000000 |
| Tuesday, January 1, 2019 | 817642000 | 4344000000 |
| Wednesday, January 1, 2020 | 1013523000 | 4149000000 |
| Friday, January 1, 2021 | 1975928000 | 4956000000 |
| Saturday, January 1, 2022 | 1916506000 | 5466000000 |
| Sunday, January 1, 2023 | 1087588000 | 5592000000 |
| Monday, January 1, 2024 | 1154330000 | 5128000000 |
In pursuit of knowledge
In the ever-evolving landscape of corporate finance, EBITDA serves as a crucial metric for evaluating a company's operational performance. Over the past decade, Waste Management, Inc. and Expeditors International of Washington, Inc. have showcased contrasting trajectories in their EBITDA growth.
From 2014 to 2023, Waste Management's EBITDA surged by approximately 60%, peaking in 2023. This growth underscores the company's robust operational efficiency and strategic market positioning. In contrast, Expeditors International experienced a more volatile journey, with a notable spike in 2021, where EBITDA nearly doubled compared to 2020, before stabilizing in subsequent years.
This comparative analysis highlights Waste Management's consistent upward trend, while Expeditors International's performance reflects a more dynamic market response. As we delve into these financial narratives, it becomes evident that strategic adaptability and market conditions play pivotal roles in shaping a company's financial health.
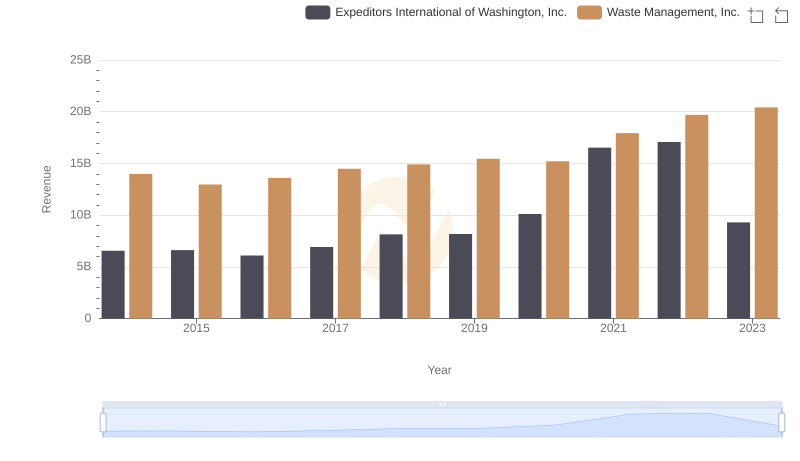
Revenue Insights: Waste Management, Inc. and Expeditors International of Washington, Inc. Performance Compared
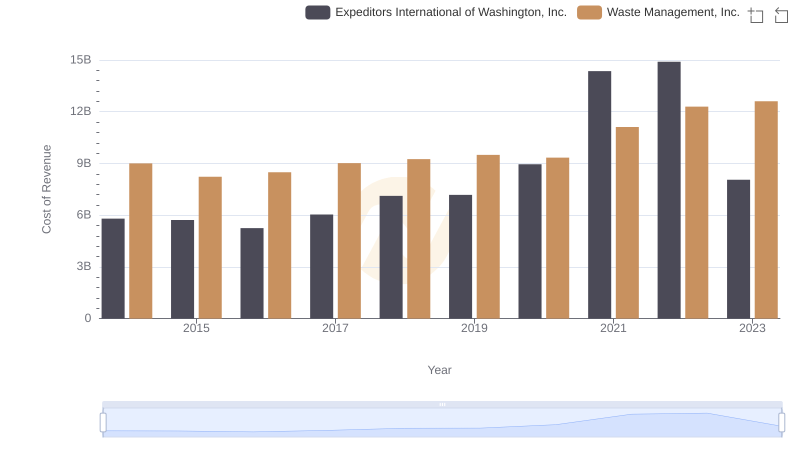
Waste Management, Inc. vs Expeditors International of Washington, Inc.: Efficiency in Cost of Revenue Explored
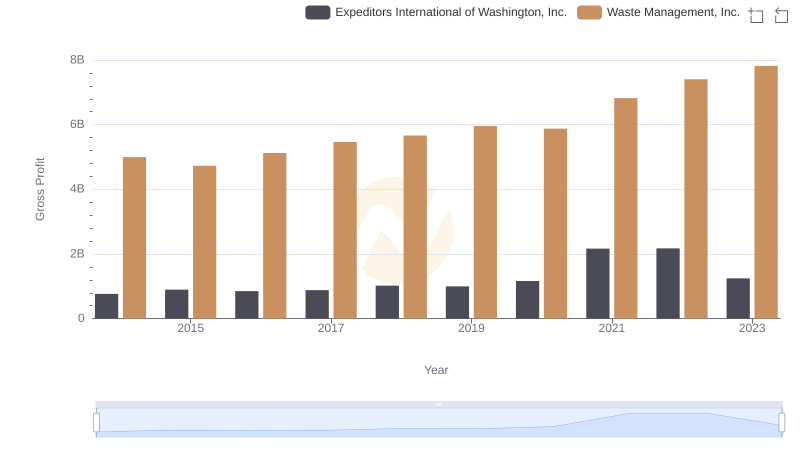
Who Generates Higher Gross Profit? Waste Management, Inc. or Expeditors International of Washington, Inc.
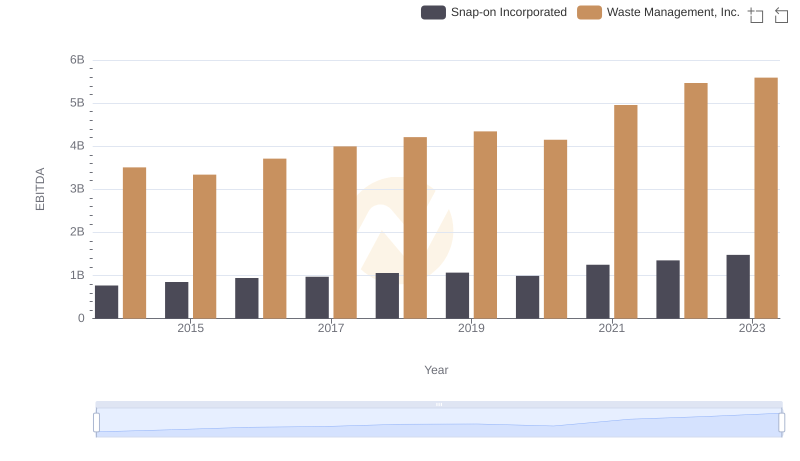
Professional EBITDA Benchmarking: Waste Management, Inc. vs Snap-on Incorporated
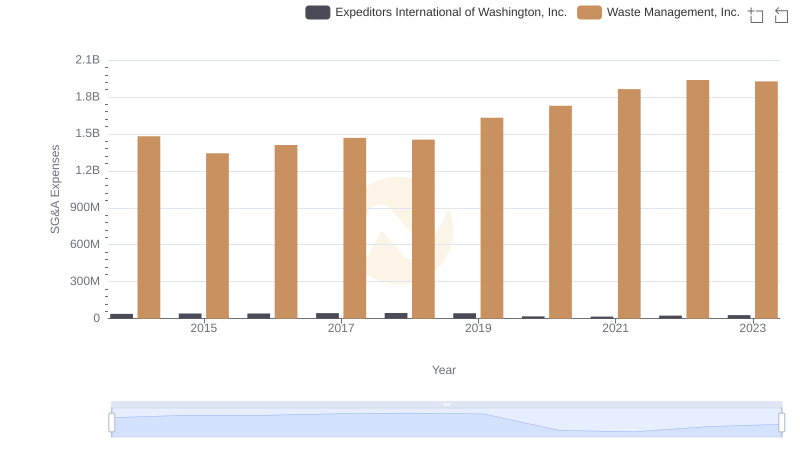
Comparing SG&A Expenses: Waste Management, Inc. vs Expeditors International of Washington, Inc. Trends and Insights
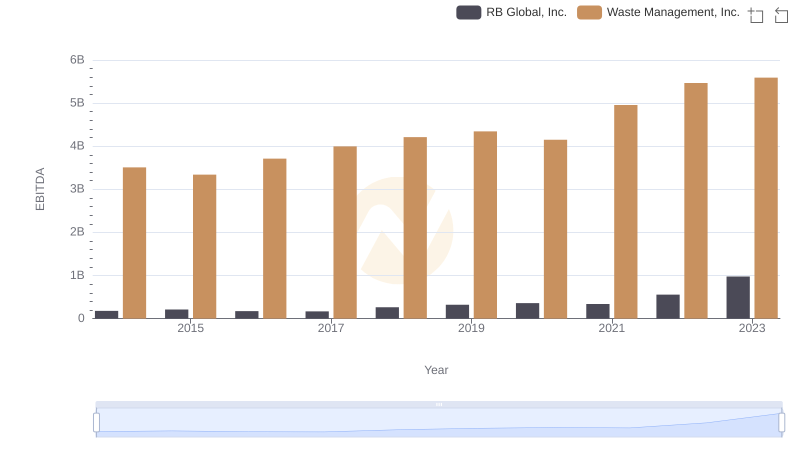
Waste Management, Inc. vs RB Global, Inc.: In-Depth EBITDA Performance Comparison
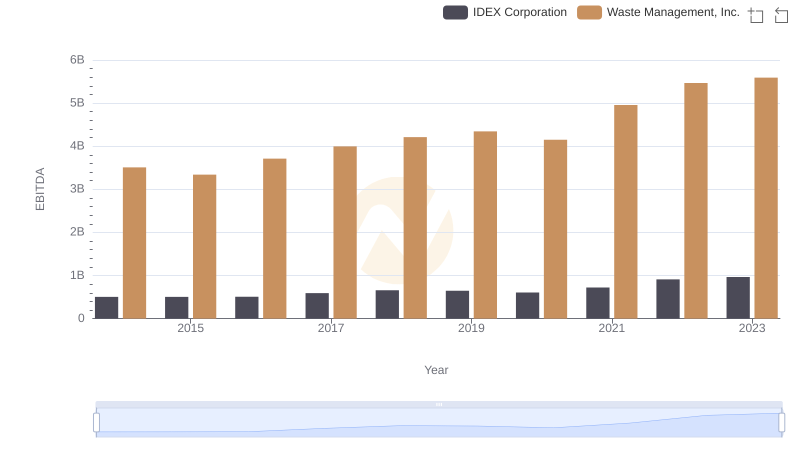
Professional EBITDA Benchmarking: Waste Management, Inc. vs IDEX Corporation
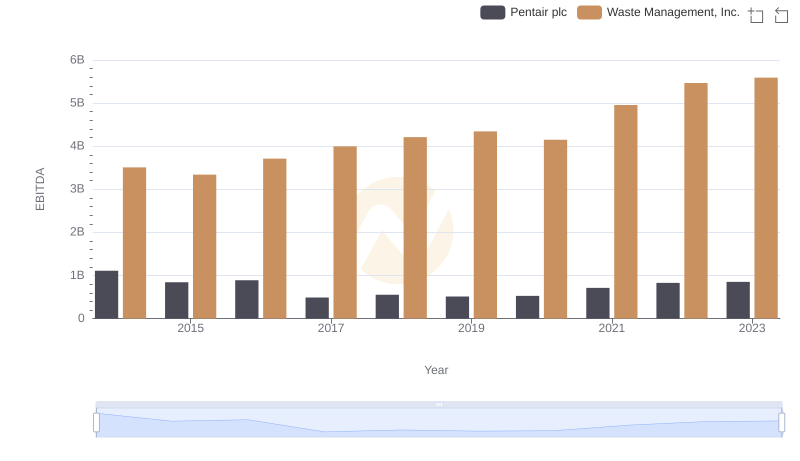
EBITDA Metrics Evaluated: Waste Management, Inc. vs Pentair plc
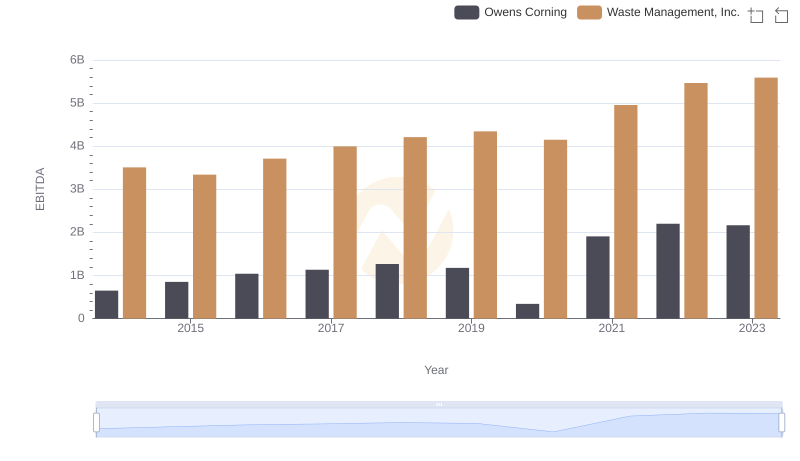
A Side-by-Side Analysis of EBITDA: Waste Management, Inc. and Owens Corning
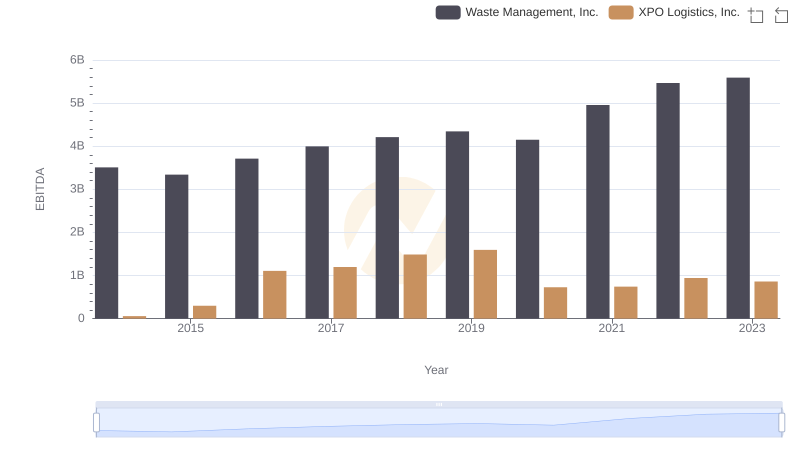
EBITDA Analysis: Evaluating Waste Management, Inc. Against XPO Logistics, Inc.
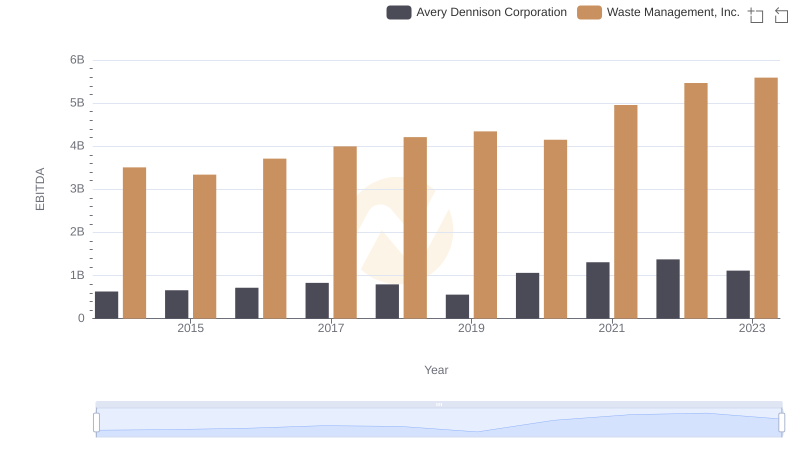
A Professional Review of EBITDA: Waste Management, Inc. Compared to Avery Dennison Corporation
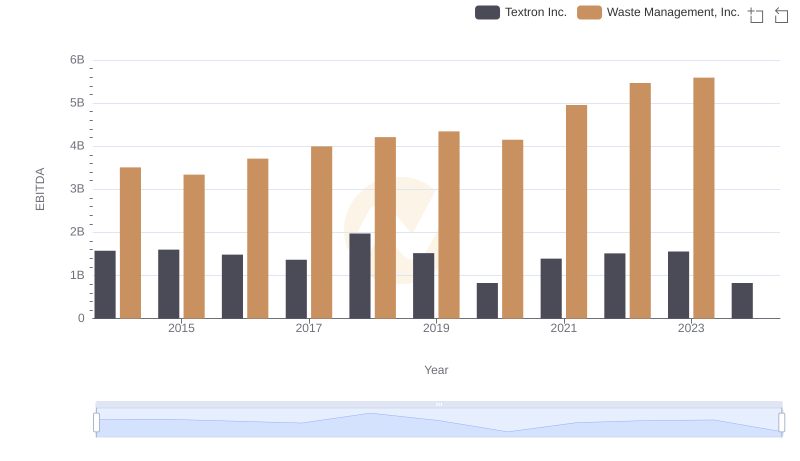
Professional EBITDA Benchmarking: Waste Management, Inc. vs Textron Inc.