| __timestamp | Intuit Inc. | ON Semiconductor Corporation |
|---|---|---|
| Wednesday, January 1, 2014 | 1762000000 | 380900000 |
| Thursday, January 1, 2015 | 1771000000 | 386600000 |
| Friday, January 1, 2016 | 1807000000 | 468300000 |
| Sunday, January 1, 2017 | 1973000000 | 600800000 |
| Monday, January 1, 2018 | 2298000000 | 618000000 |
| Tuesday, January 1, 2019 | 2524000000 | 585000000 |
| Wednesday, January 1, 2020 | 2727000000 | 537400000 |
| Friday, January 1, 2021 | 3626000000 | 598400000 |
| Saturday, January 1, 2022 | 4986000000 | 631100000 |
| Sunday, January 1, 2023 | 5062000000 | 641500000 |
| Monday, January 1, 2024 | 5730000000 | 649800000 |
Unleashing the power of data
In the ever-evolving landscape of corporate finance, understanding the trends in Selling, General, and Administrative (SG&A) expenses is crucial for investors and analysts alike. Over the past decade, Intuit Inc. has demonstrated a remarkable upward trajectory in its SG&A expenses, growing by approximately 225% from 2014 to 2023. This reflects the company's strategic investments in marketing, administration, and sales to bolster its market position.
Conversely, ON Semiconductor Corporation has shown a more modest increase of around 68% in the same period, indicating a more conservative approach to its operational expenditures. Notably, the data for 2024 is incomplete for ON Semiconductor, suggesting a need for further analysis once the figures are available.
These trends highlight the contrasting strategies of these two industry giants, offering valuable insights into their operational priorities and financial health.
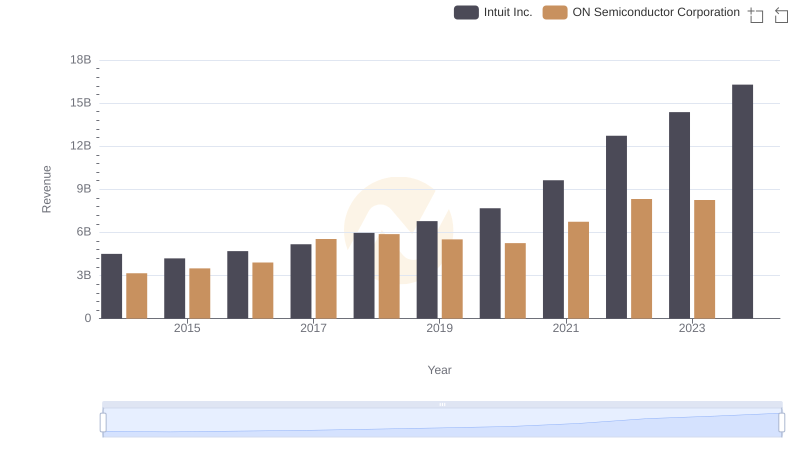
Revenue Showdown: Intuit Inc. vs ON Semiconductor Corporation
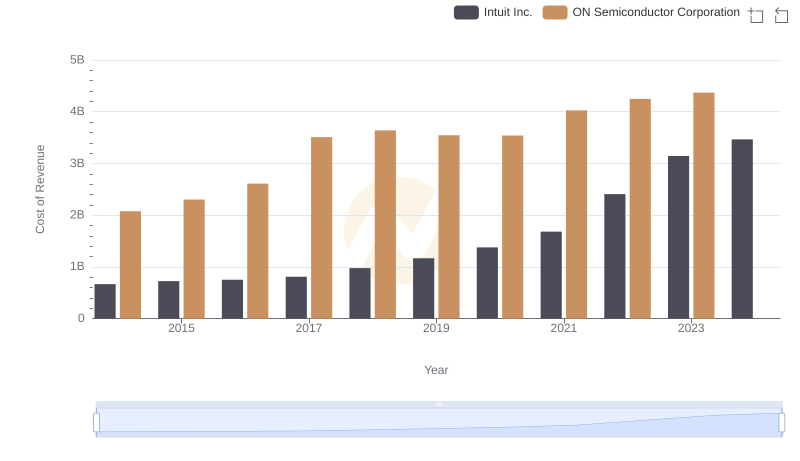
Comparing Cost of Revenue Efficiency: Intuit Inc. vs ON Semiconductor Corporation
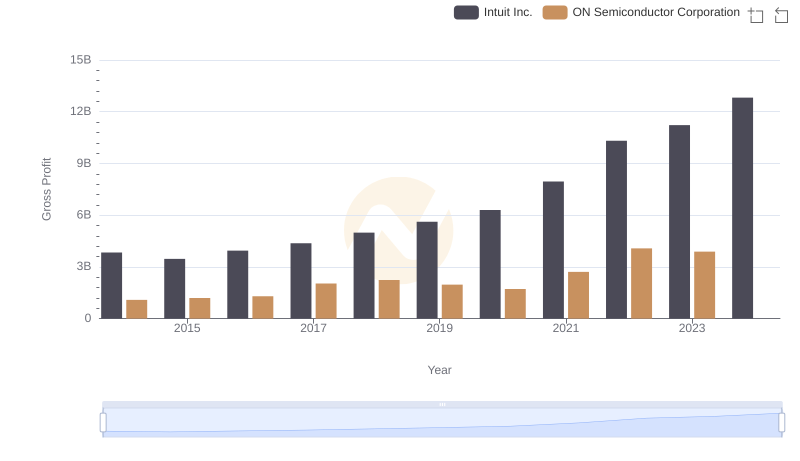
Intuit Inc. vs ON Semiconductor Corporation: A Gross Profit Performance Breakdown
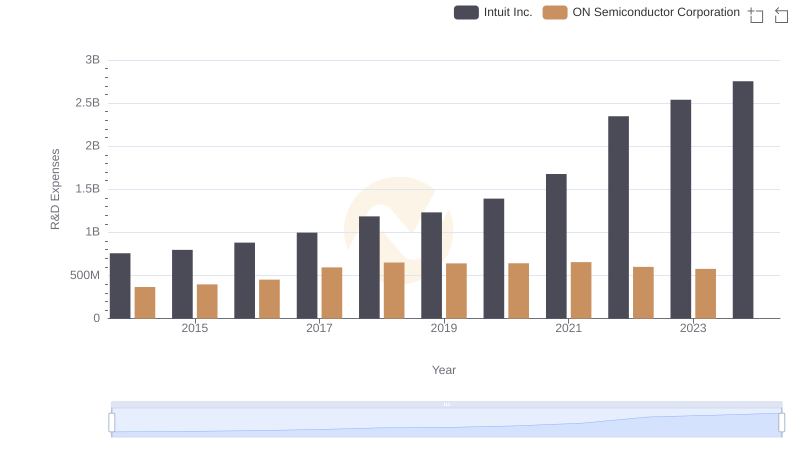
Research and Development Expenses Breakdown: Intuit Inc. vs ON Semiconductor Corporation
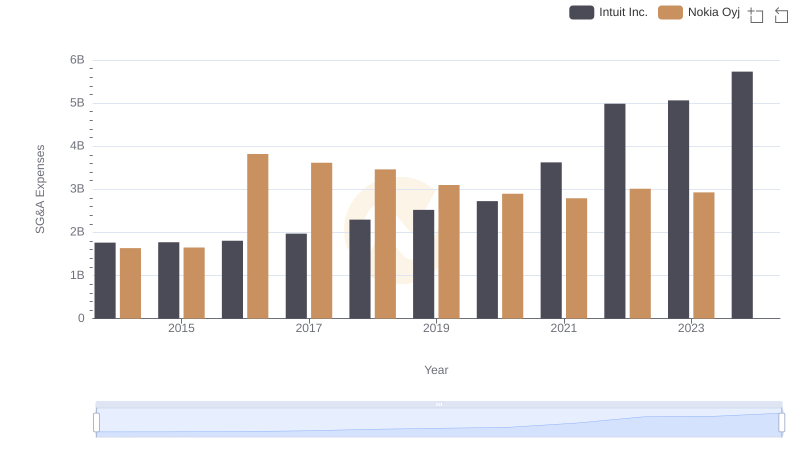
SG&A Efficiency Analysis: Comparing Intuit Inc. and Nokia Oyj
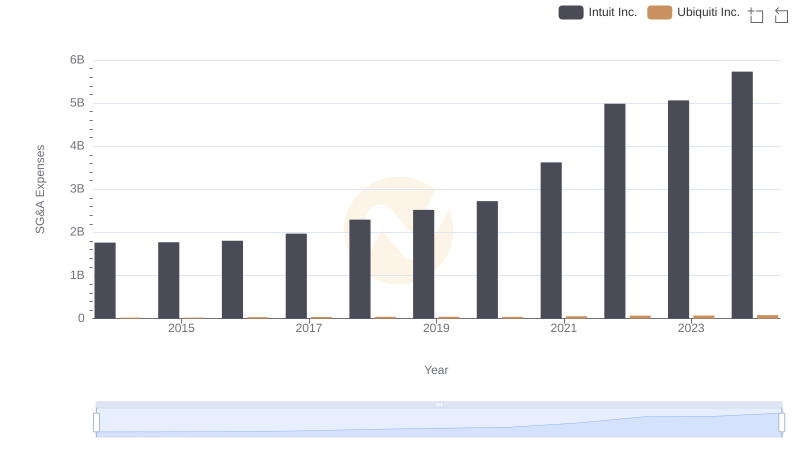
Breaking Down SG&A Expenses: Intuit Inc. vs Ubiquiti Inc.
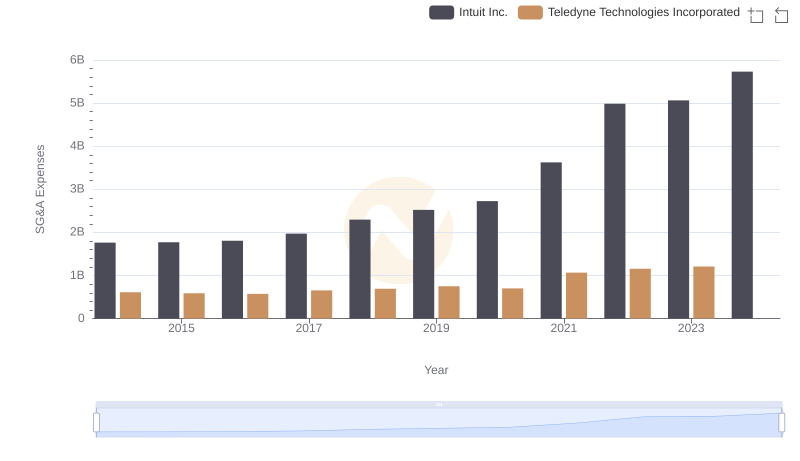
Breaking Down SG&A Expenses: Intuit Inc. vs Teledyne Technologies Incorporated
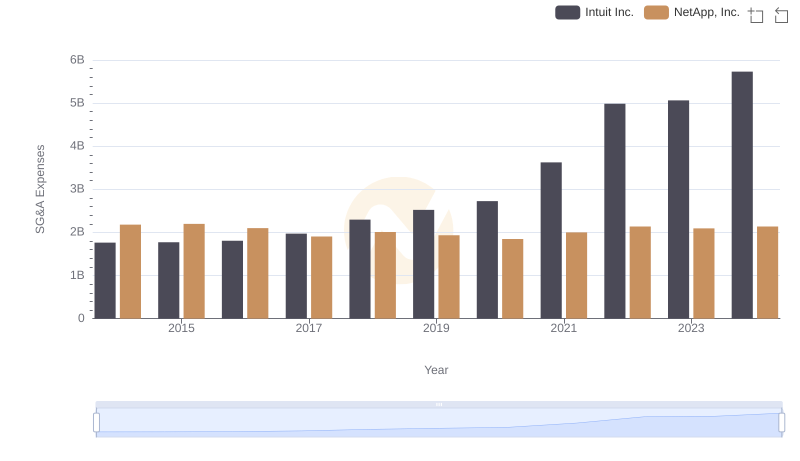
Intuit Inc. or NetApp, Inc.: Who Manages SG&A Costs Better?
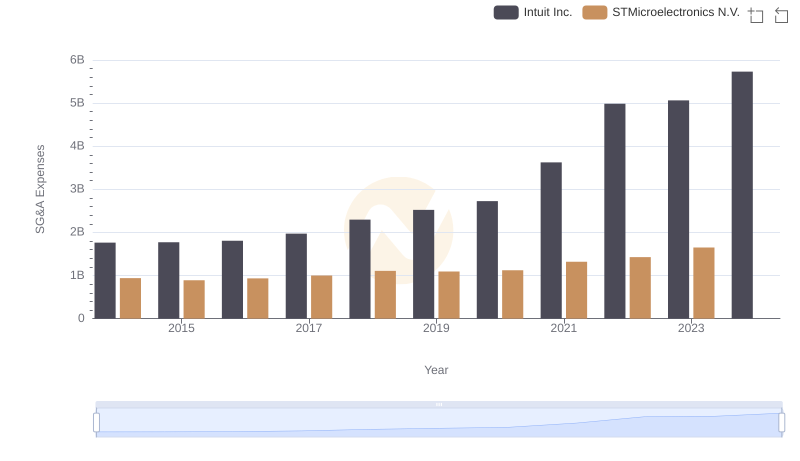
Cost Management Insights: SG&A Expenses for Intuit Inc. and STMicroelectronics N.V.
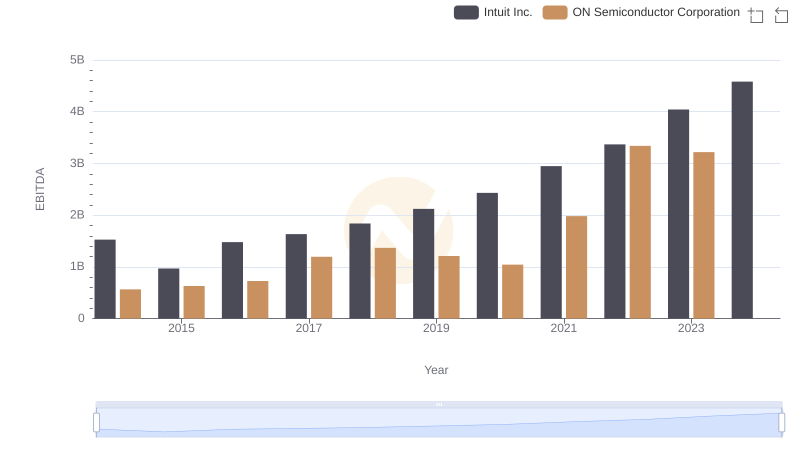
EBITDA Analysis: Evaluating Intuit Inc. Against ON Semiconductor Corporation
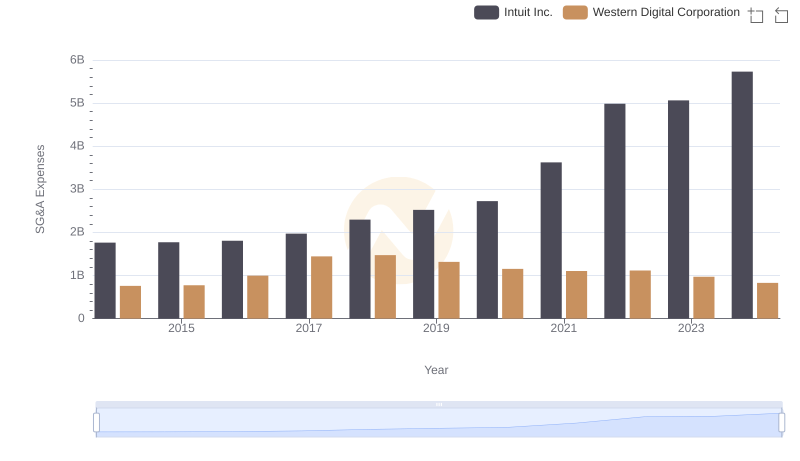
Intuit Inc. or Western Digital Corporation: Who Manages SG&A Costs Better?