| __timestamp | Intuit Inc. | ON Semiconductor Corporation |
|---|---|---|
| Wednesday, January 1, 2014 | 668000000 | 2076900000 |
| Thursday, January 1, 2015 | 725000000 | 2302600000 |
| Friday, January 1, 2016 | 752000000 | 2610000000 |
| Sunday, January 1, 2017 | 809000000 | 3509300000 |
| Monday, January 1, 2018 | 977000000 | 3639600000 |
| Tuesday, January 1, 2019 | 1167000000 | 3544300000 |
| Wednesday, January 1, 2020 | 1378000000 | 3539200000 |
| Friday, January 1, 2021 | 1683000000 | 4025500000 |
| Saturday, January 1, 2022 | 2406000000 | 4249000000 |
| Sunday, January 1, 2023 | 3143000000 | 4369500000 |
| Monday, January 1, 2024 | 3465000000 | 3866200000 |
Igniting the spark of knowledge
In the ever-evolving landscape of technology and finance, understanding cost efficiency is paramount. This chart offers a fascinating glimpse into the cost of revenue trends for Intuit Inc. and ON Semiconductor Corporation from 2014 to 2023. Over this decade, Intuit Inc. has seen its cost of revenue grow by over 400%, starting from approximately $668 million in 2014 to a staggering $3.143 billion in 2023. Meanwhile, ON Semiconductor Corporation has experienced a more modest increase of around 110%, with costs rising from $2.077 billion to $4.369 billion in the same period.
The data reveals a compelling narrative of growth and adaptation. Intuit's rapid increase in cost of revenue suggests aggressive expansion and investment in new technologies, while ON Semiconductor's steadier growth reflects a more measured approach. Missing data for 2024 indicates potential shifts in strategy or reporting, adding an element of intrigue to future analyses.
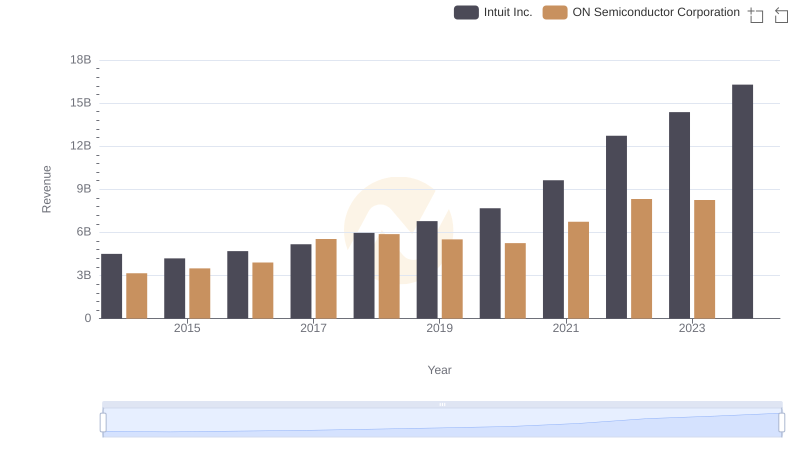
Revenue Showdown: Intuit Inc. vs ON Semiconductor Corporation
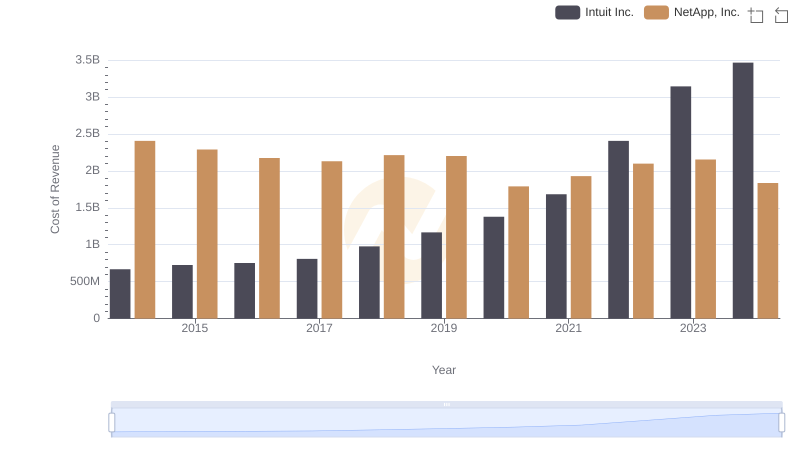
Comparing Cost of Revenue Efficiency: Intuit Inc. vs NetApp, Inc.
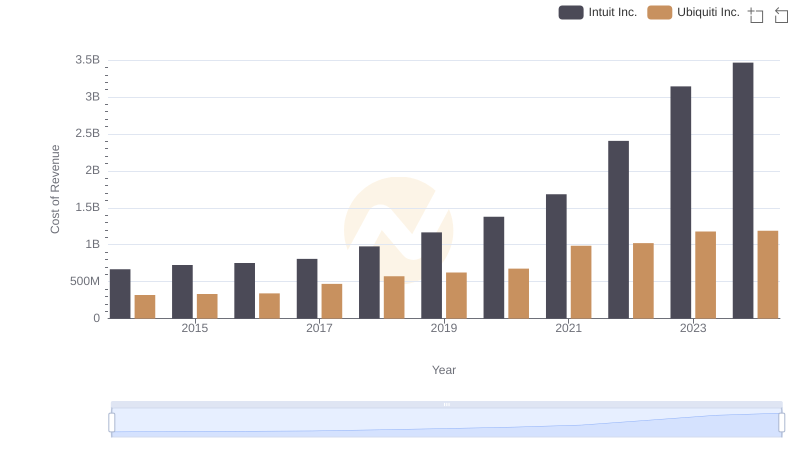
Cost of Revenue Comparison: Intuit Inc. vs Ubiquiti Inc.
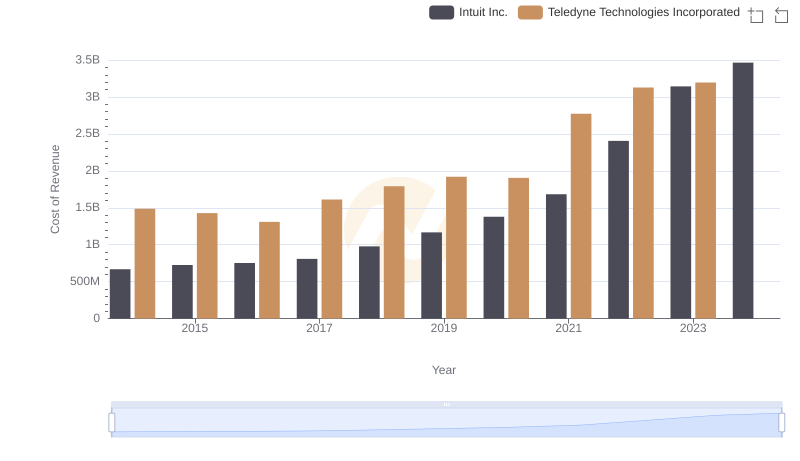
Intuit Inc. vs Teledyne Technologies Incorporated: Efficiency in Cost of Revenue Explored
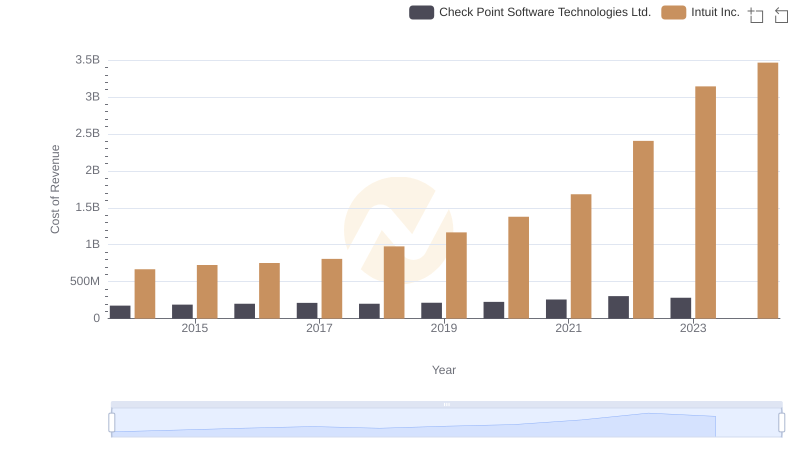
Comparing Cost of Revenue Efficiency: Intuit Inc. vs Check Point Software Technologies Ltd.
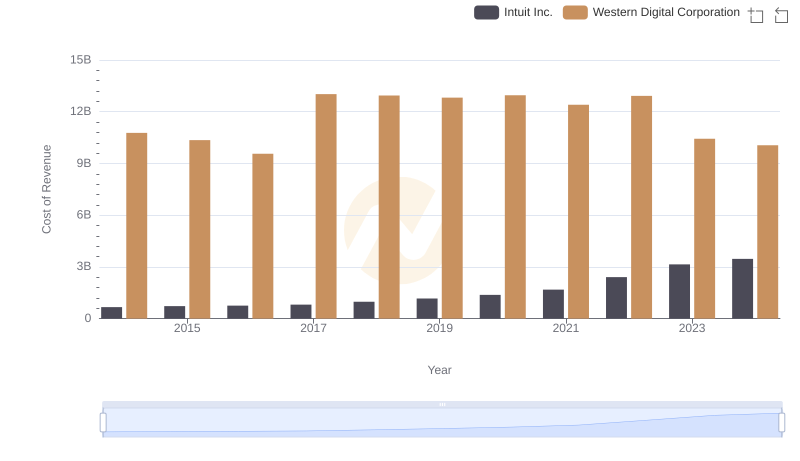
Cost of Revenue Trends: Intuit Inc. vs Western Digital Corporation
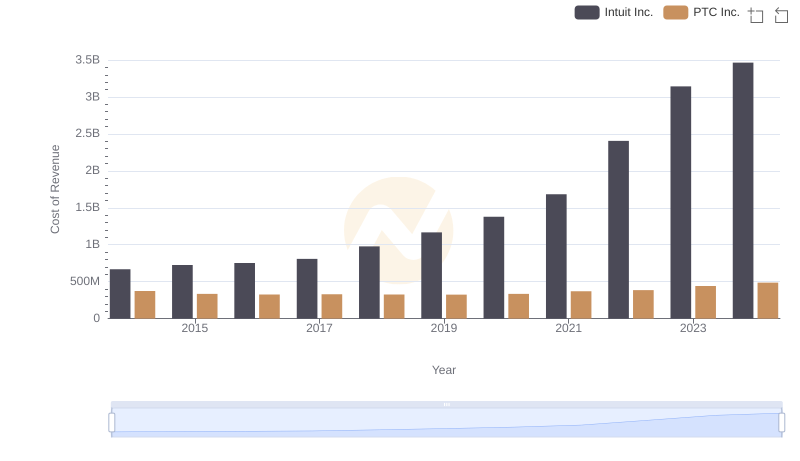
Cost of Revenue: Key Insights for Intuit Inc. and PTC Inc.
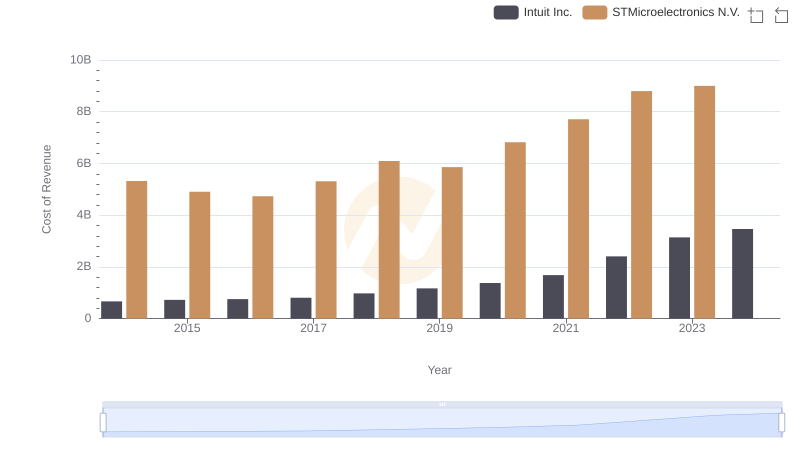
Cost Insights: Breaking Down Intuit Inc. and STMicroelectronics N.V.'s Expenses
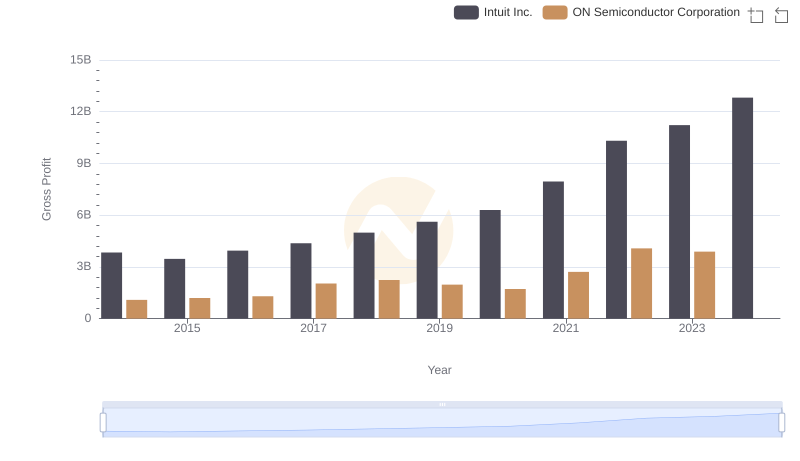
Intuit Inc. vs ON Semiconductor Corporation: A Gross Profit Performance Breakdown
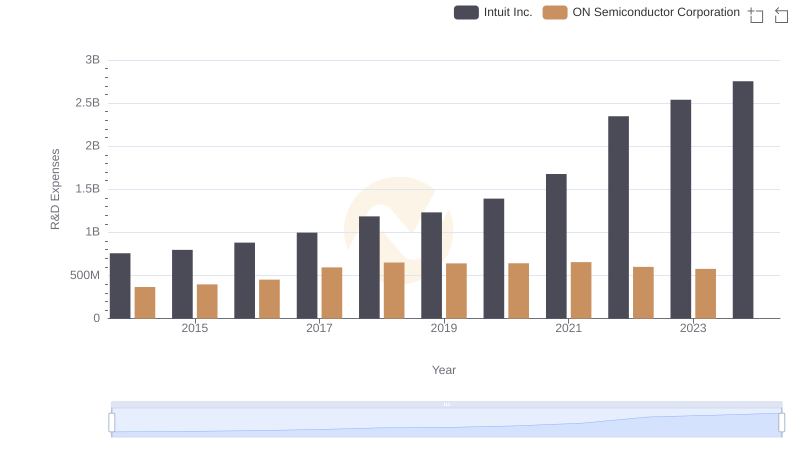
Research and Development Expenses Breakdown: Intuit Inc. vs ON Semiconductor Corporation
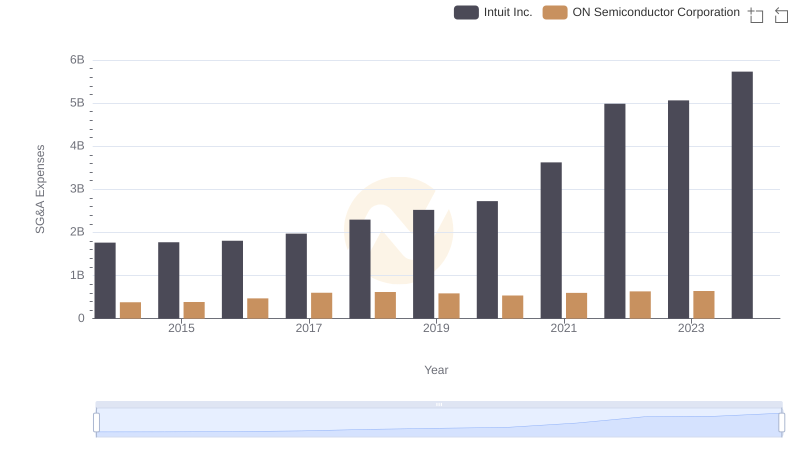
Intuit Inc. vs ON Semiconductor Corporation: SG&A Expense Trends
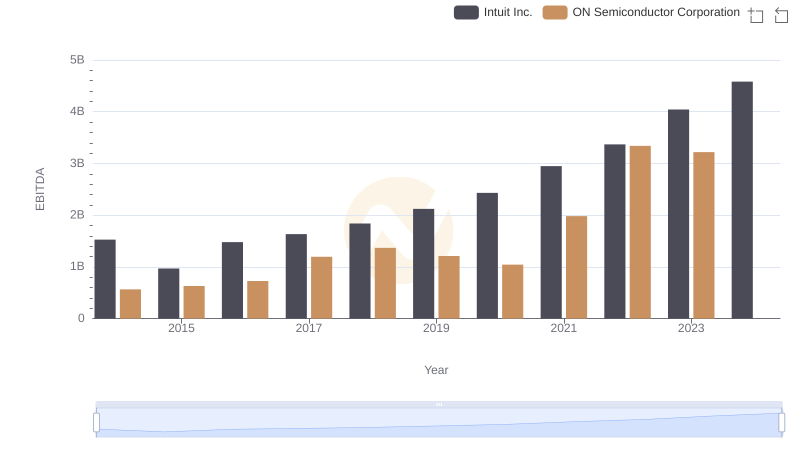
EBITDA Analysis: Evaluating Intuit Inc. Against ON Semiconductor Corporation