| __timestamp | Intuit Inc. | Ubiquiti Inc. |
|---|---|---|
| Wednesday, January 1, 2014 | 1528000000 | 198764000 |
| Thursday, January 1, 2015 | 970000000 | 190986000 |
| Friday, January 1, 2016 | 1480000000 | 248349000 |
| Sunday, January 1, 2017 | 1634000000 | 289761000 |
| Monday, January 1, 2018 | 1839000000 | 333437000 |
| Tuesday, January 1, 2019 | 2121000000 | 401853000 |
| Wednesday, January 1, 2020 | 2430000000 | 485893000 |
| Friday, January 1, 2021 | 2948000000 | 742592000 |
| Saturday, January 1, 2022 | 3369000000 | 462264000 |
| Sunday, January 1, 2023 | 4043000000 | 560858000 |
| Monday, January 1, 2024 | 4581000000 | 518248000 |
Unleashing insights
In the ever-evolving landscape of technology, financial performance is a key indicator of a company's resilience and growth. Over the past decade, Intuit Inc. and Ubiquiti Inc. have showcased contrasting trajectories in their EBITDA, a crucial measure of profitability.
From 2014 to 2024, Intuit Inc. has demonstrated a robust growth, with its EBITDA surging by nearly 200%, reflecting its strategic expansions and innovations in financial software. In contrast, Ubiquiti Inc. has experienced a more modest growth of approximately 160%, indicating steady progress in the networking technology sector.
The year 2021 marked a significant peak for Ubiquiti, with a 52% increase from the previous year, while Intuit's EBITDA consistently climbed, reaching its zenith in 2024. This comparison not only highlights the dynamic nature of the tech industry but also underscores the importance of strategic foresight in achieving financial success.
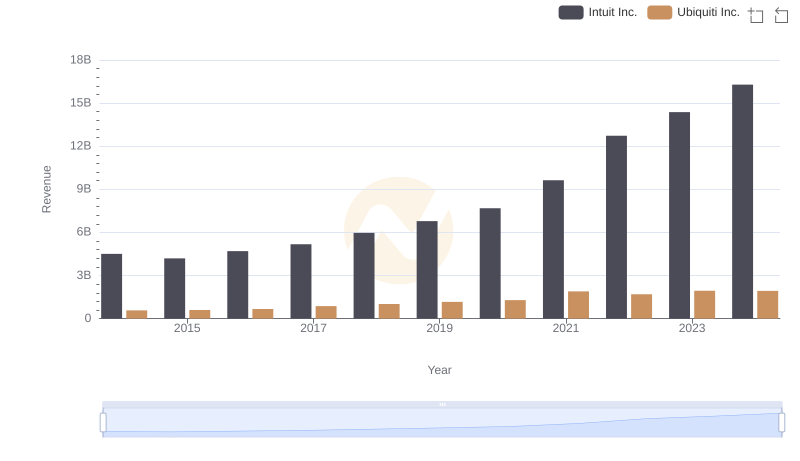
Revenue Insights: Intuit Inc. and Ubiquiti Inc. Performance Compared
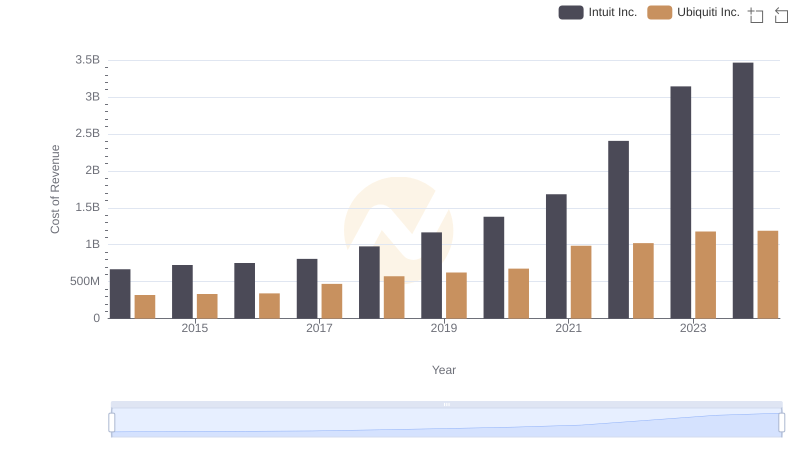
Cost of Revenue Comparison: Intuit Inc. vs Ubiquiti Inc.
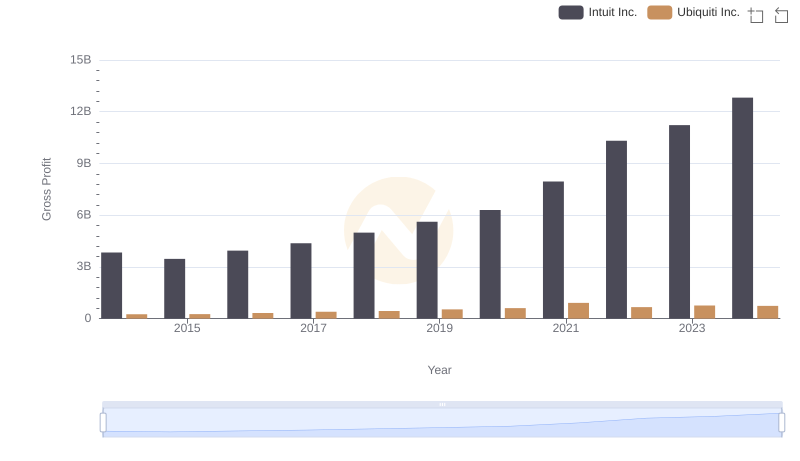
Intuit Inc. and Ubiquiti Inc.: A Detailed Gross Profit Analysis
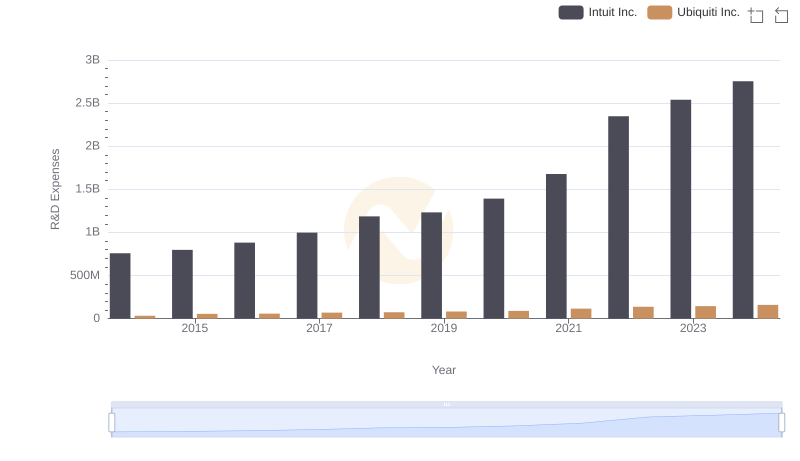
Research and Development: Comparing Key Metrics for Intuit Inc. and Ubiquiti Inc.
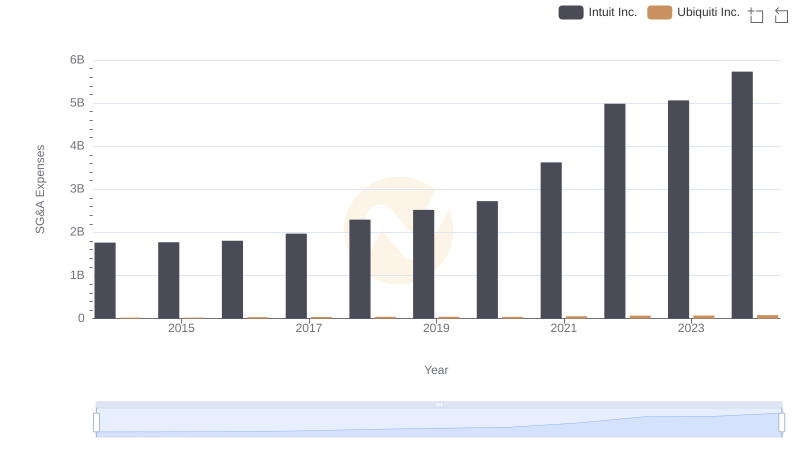
Breaking Down SG&A Expenses: Intuit Inc. vs Ubiquiti Inc.
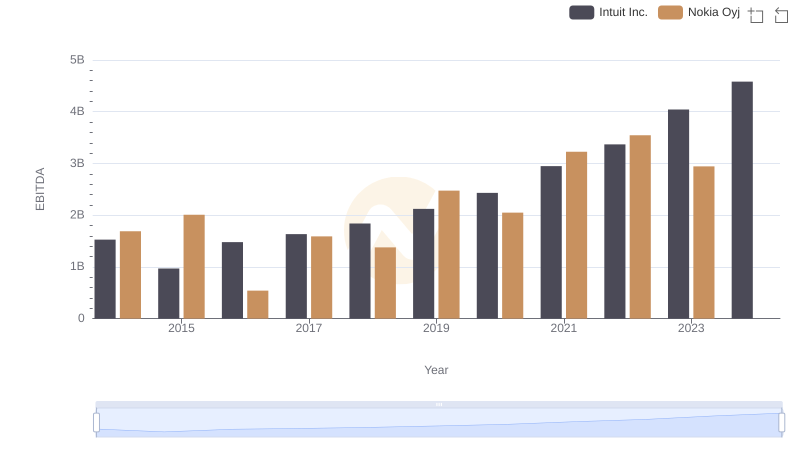
EBITDA Metrics Evaluated: Intuit Inc. vs Nokia Oyj
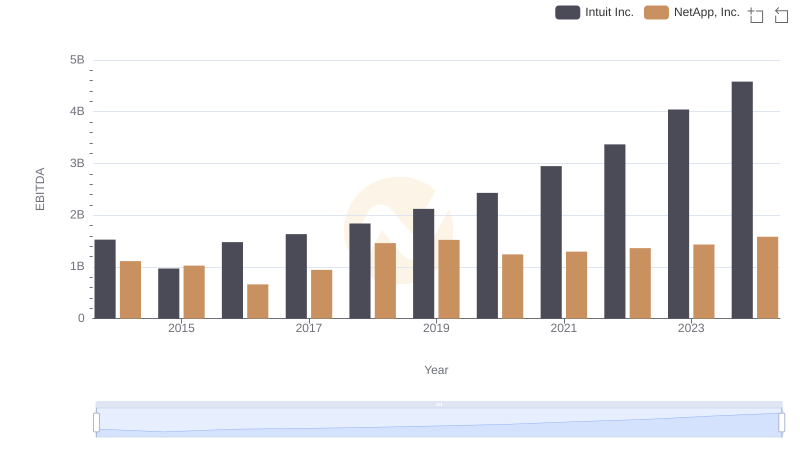
A Side-by-Side Analysis of EBITDA: Intuit Inc. and NetApp, Inc.
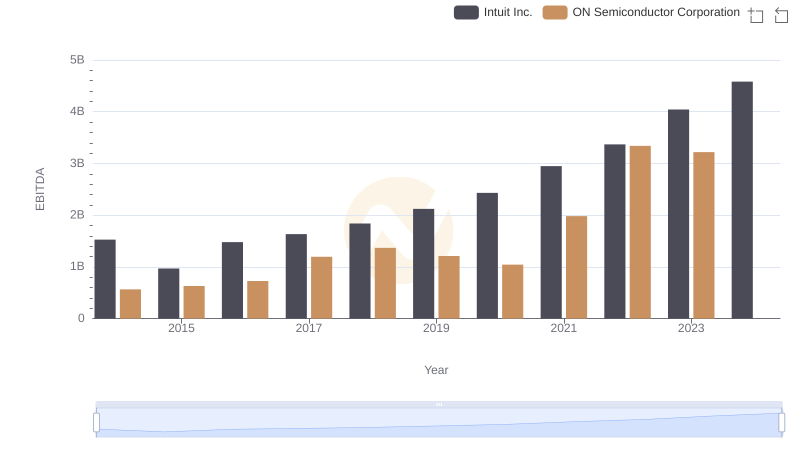
EBITDA Analysis: Evaluating Intuit Inc. Against ON Semiconductor Corporation

Intuit Inc. and Teledyne Technologies Incorporated: A Detailed Examination of EBITDA Performance
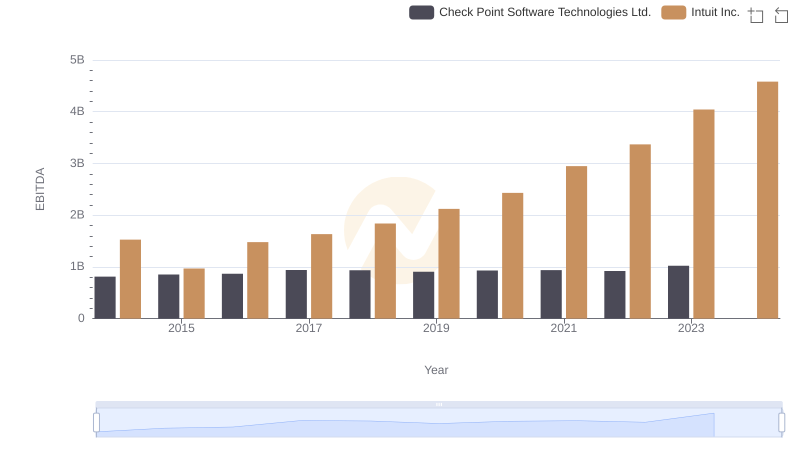
Professional EBITDA Benchmarking: Intuit Inc. vs Check Point Software Technologies Ltd.
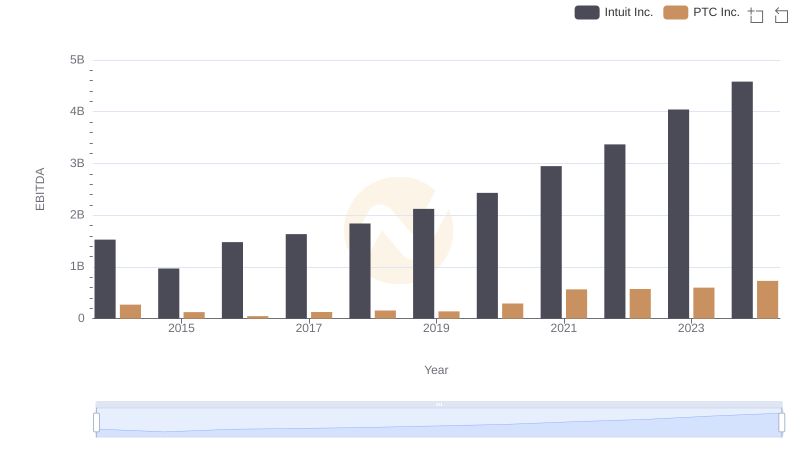
Intuit Inc. vs PTC Inc.: In-Depth EBITDA Performance Comparison
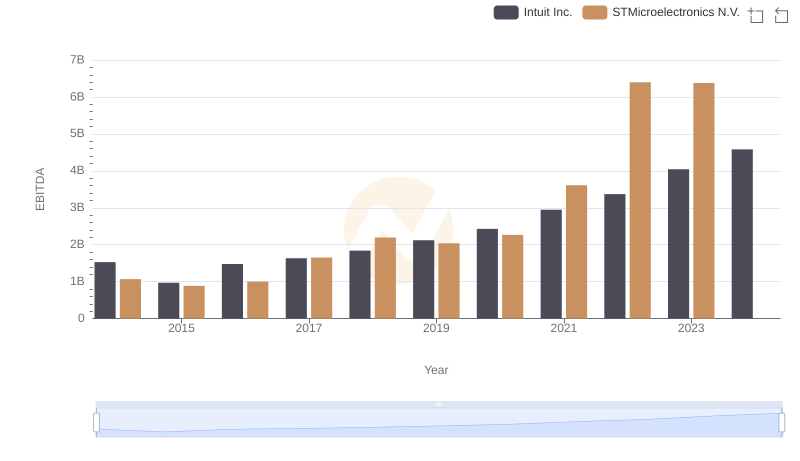
EBITDA Analysis: Evaluating Intuit Inc. Against STMicroelectronics N.V.