| __timestamp | Cadence Design Systems, Inc. | International Business Machines Corporation |
|---|---|---|
| Wednesday, January 1, 2014 | 223706000 | 46386000000 |
| Thursday, January 1, 2015 | 238453000 | 41057000000 |
| Friday, January 1, 2016 | 256492000 | 41403000000 |
| Sunday, January 1, 2017 | 237390000 | 42196000000 |
| Monday, January 1, 2018 | 258747000 | 42655000000 |
| Tuesday, January 1, 2019 | 266357000 | 26181000000 |
| Wednesday, January 1, 2020 | 305498000 | 24314000000 |
| Friday, January 1, 2021 | 307006000 | 25865000000 |
| Saturday, January 1, 2022 | 371623000 | 27842000000 |
| Sunday, January 1, 2023 | 435041000 | 27560000000 |
| Monday, January 1, 2024 | 210902000 | 27202000000 |
Igniting the spark of knowledge
In the ever-evolving landscape of technology, the cost of revenue is a critical metric that reflects a company's operational efficiency. From 2014 to 2023, International Business Machines Corporation (IBM) and Cadence Design Systems, Inc. have showcased contrasting financial narratives. IBM, a stalwart in the tech industry, has consistently reported a cost of revenue averaging around $36.5 billion annually, with a notable peak in 2014. In contrast, Cadence Design Systems, a leader in electronic design automation, has demonstrated a steady growth trajectory, with its cost of revenue increasing by nearly 95% over the same period.
While IBM's cost of revenue has seen a decline of approximately 41% from its 2014 peak, Cadence has experienced a robust upward trend, reflecting its strategic expansion and market adaptation. This comparison not only highlights the dynamic nature of the tech industry but also underscores the diverse strategies employed by these two giants.
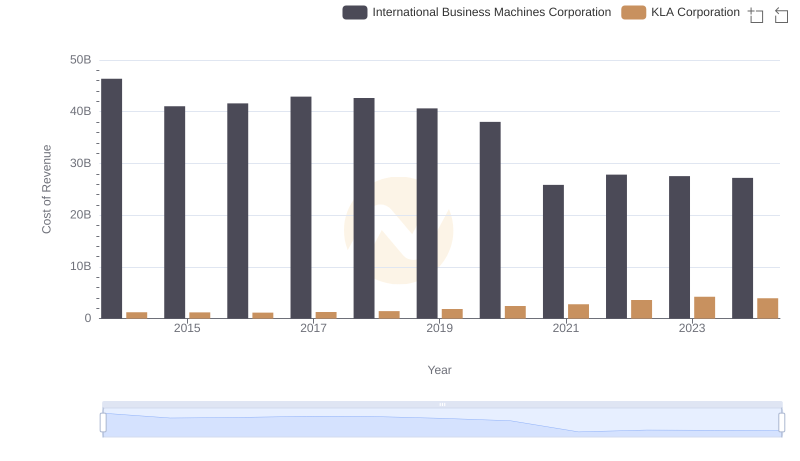
Cost Insights: Breaking Down International Business Machines Corporation and KLA Corporation's Expenses
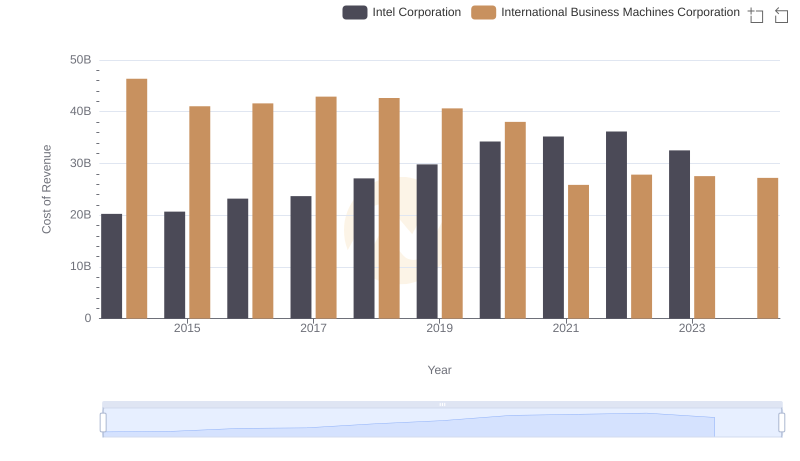
Cost Insights: Breaking Down International Business Machines Corporation and Intel Corporation's Expenses
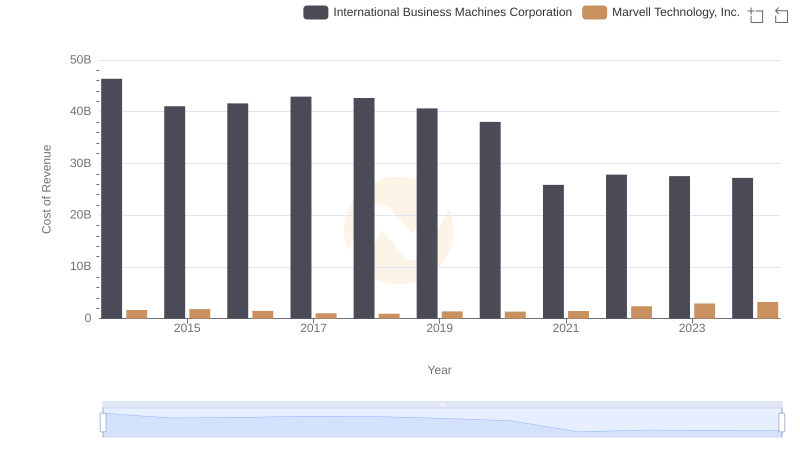
Cost Insights: Breaking Down International Business Machines Corporation and Marvell Technology, Inc.'s Expenses
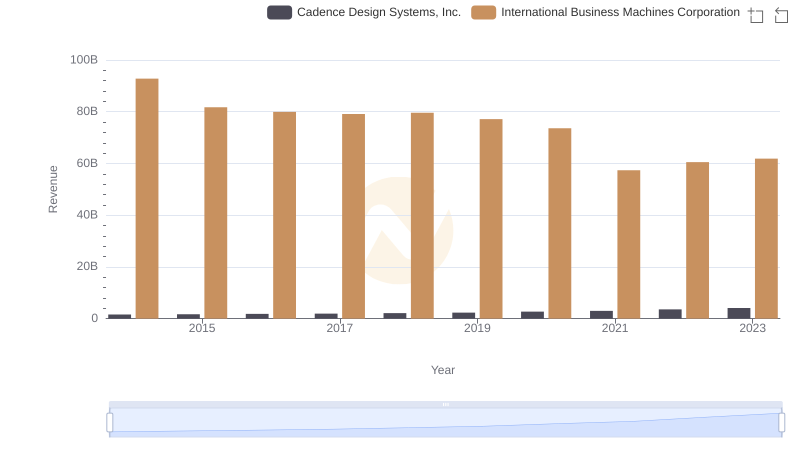
International Business Machines Corporation or Cadence Design Systems, Inc.: Who Leads in Yearly Revenue?
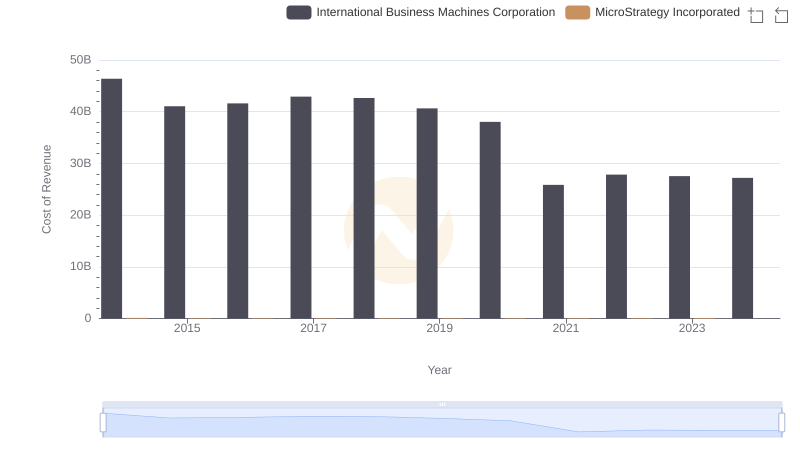
Cost of Revenue: Key Insights for International Business Machines Corporation and MicroStrategy Incorporated
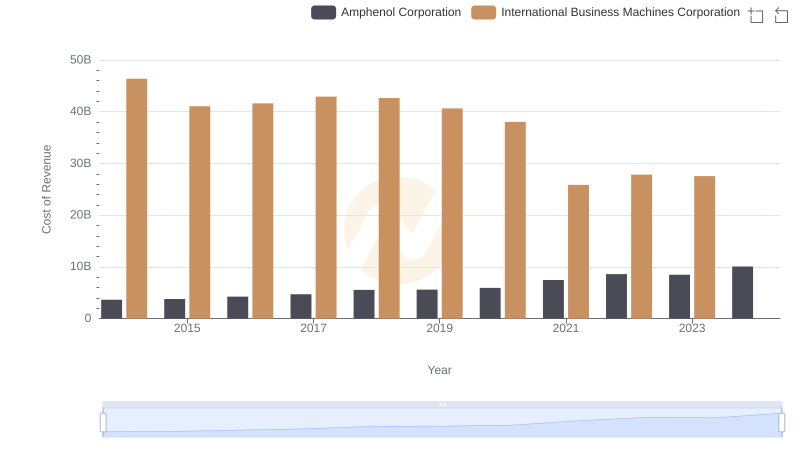
Comparing Cost of Revenue Efficiency: International Business Machines Corporation vs Amphenol Corporation

Cost of Revenue Comparison: International Business Machines Corporation vs Synopsys, Inc.
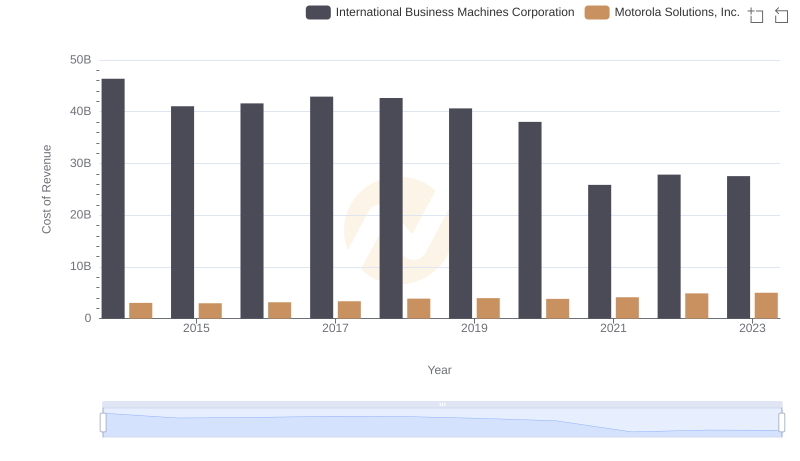
Analyzing Cost of Revenue: International Business Machines Corporation and Motorola Solutions, Inc.
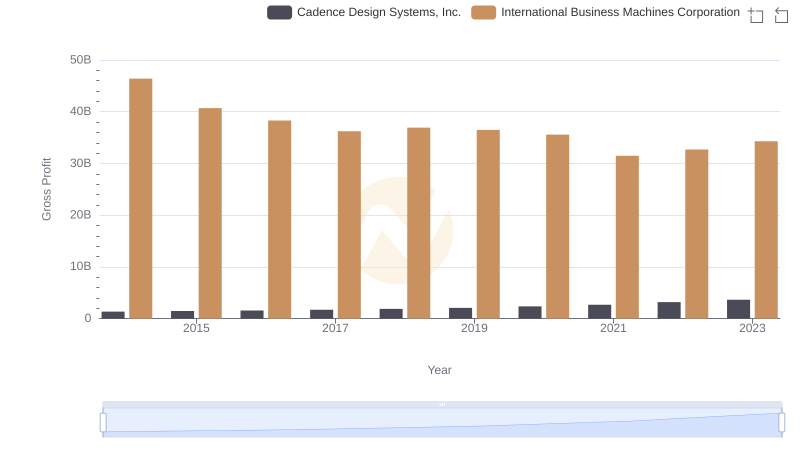
Gross Profit Analysis: Comparing International Business Machines Corporation and Cadence Design Systems, Inc.
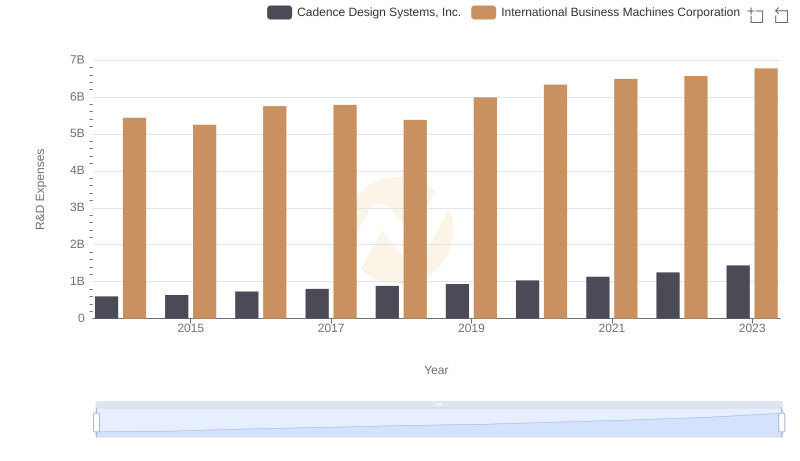
International Business Machines Corporation or Cadence Design Systems, Inc.: Who Invests More in Innovation?
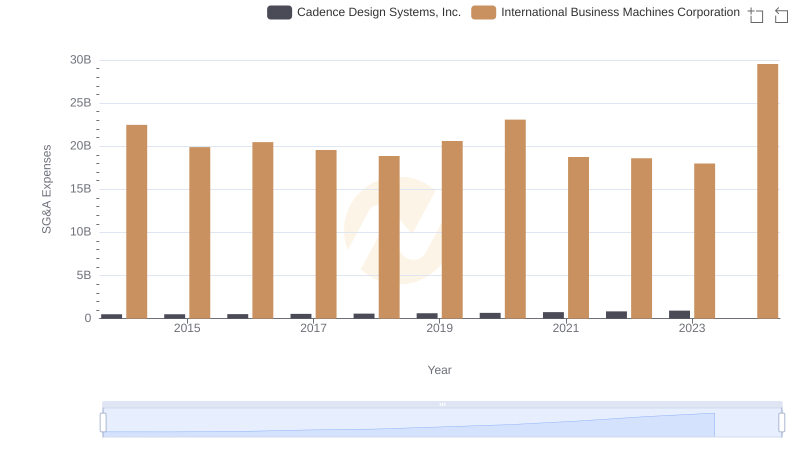
Cost Management Insights: SG&A Expenses for International Business Machines Corporation and Cadence Design Systems, Inc.
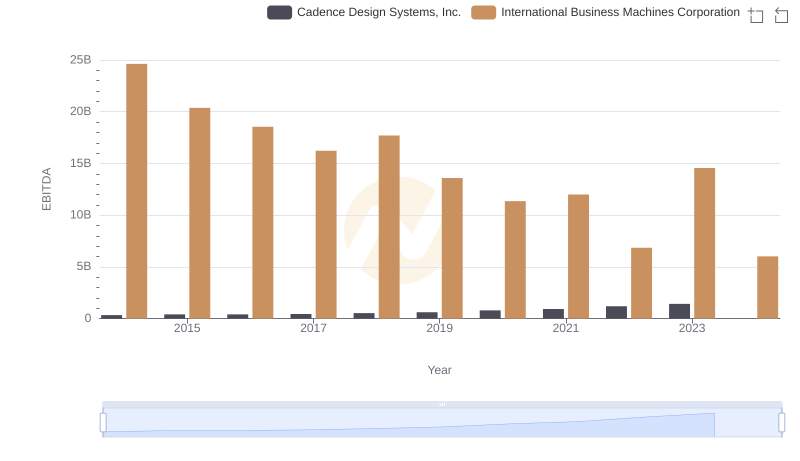
EBITDA Analysis: Evaluating International Business Machines Corporation Against Cadence Design Systems, Inc.