| __timestamp | Arista Networks, Inc. | International Business Machines Corporation |
|---|---|---|
| Wednesday, January 1, 2014 | 137809000 | 24962000000 |
| Thursday, January 1, 2015 | 162832000 | 20268000000 |
| Friday, January 1, 2016 | 265110000 | 17341000000 |
| Sunday, January 1, 2017 | 498180000 | 16556000000 |
| Monday, January 1, 2018 | 318202000 | 16545000000 |
| Tuesday, January 1, 2019 | 838623000 | 14609000000 |
| Wednesday, January 1, 2020 | 699684000 | 10555000000 |
| Friday, January 1, 2021 | 975073000 | 12409000000 |
| Saturday, January 1, 2022 | 1589806000 | 7174000000 |
| Sunday, January 1, 2023 | 2327879000 | 14693000000 |
| Monday, January 1, 2024 | 2944616000 | 6015000000 |
Unveiling the hidden dimensions of data
In the ever-evolving landscape of technology, the financial performance of industry leaders offers a window into their strategic prowess. Over the past decade, International Business Machines Corporation (IBM) and Arista Networks, Inc. have showcased contrasting trajectories in EBITDA growth. From 2014 to 2023, IBM's EBITDA has seen a decline of approximately 41%, reflecting challenges in adapting to the rapidly changing tech environment. In contrast, Arista Networks has experienced a staggering growth of over 1,500% in the same period, underscoring its agility and innovation in the networking sector.
While IBM's EBITDA peaked in 2014, Arista's financial ascent has been consistent, with a notable surge in 2023. This divergence highlights the shifting dynamics in the tech industry, where nimble players like Arista are gaining ground. As we look to the future, the question remains: Can IBM reinvent itself to reclaim its former glory?
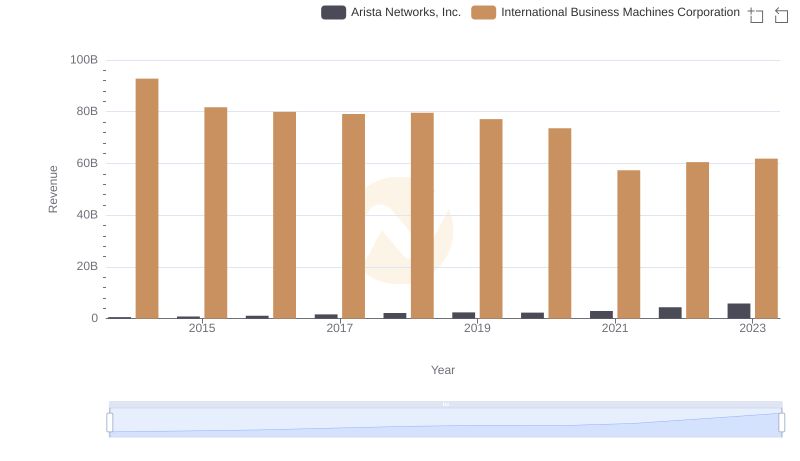
Annual Revenue Comparison: International Business Machines Corporation vs Arista Networks, Inc.
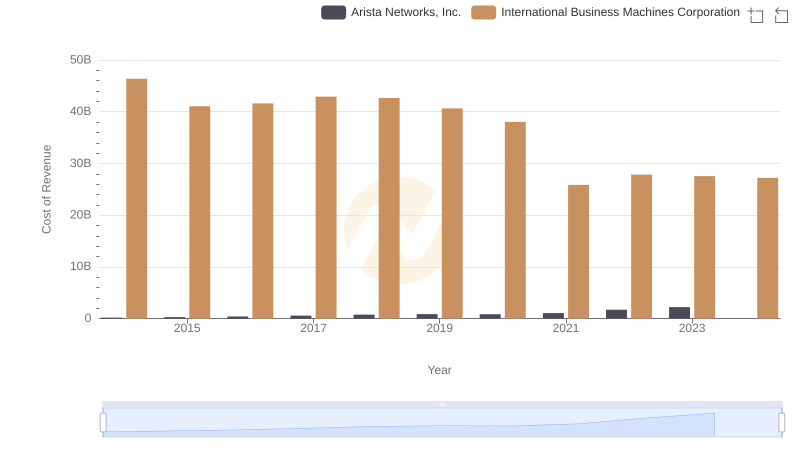
Analyzing Cost of Revenue: International Business Machines Corporation and Arista Networks, Inc.
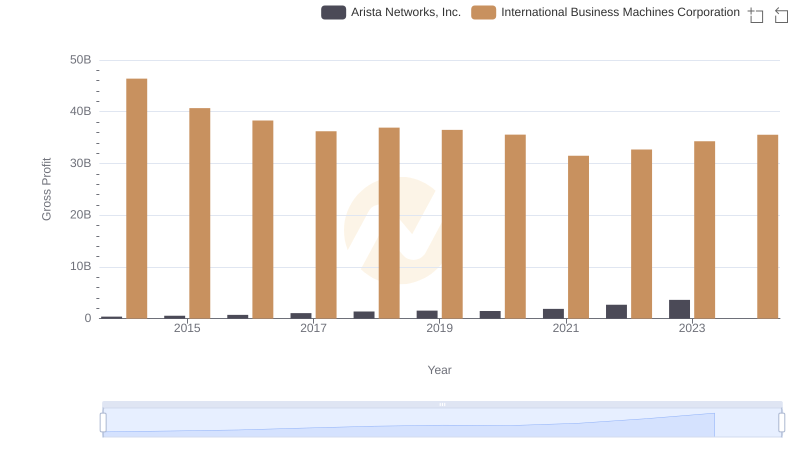
Who Generates Higher Gross Profit? International Business Machines Corporation or Arista Networks, Inc.
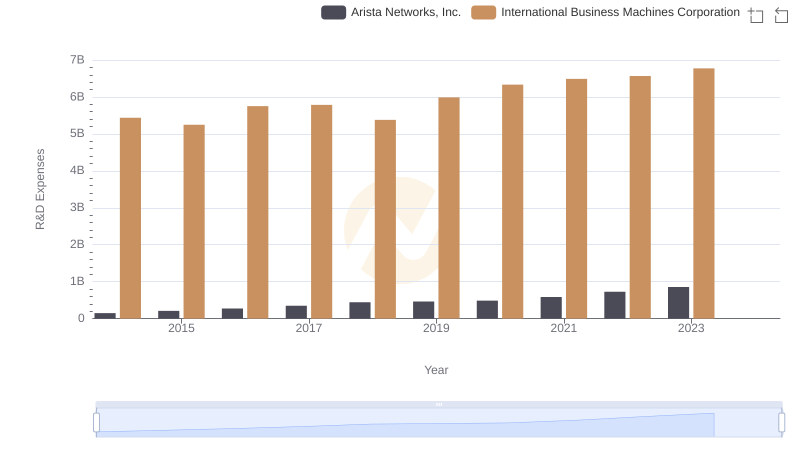
International Business Machines Corporation vs Arista Networks, Inc.: Strategic Focus on R&D Spending
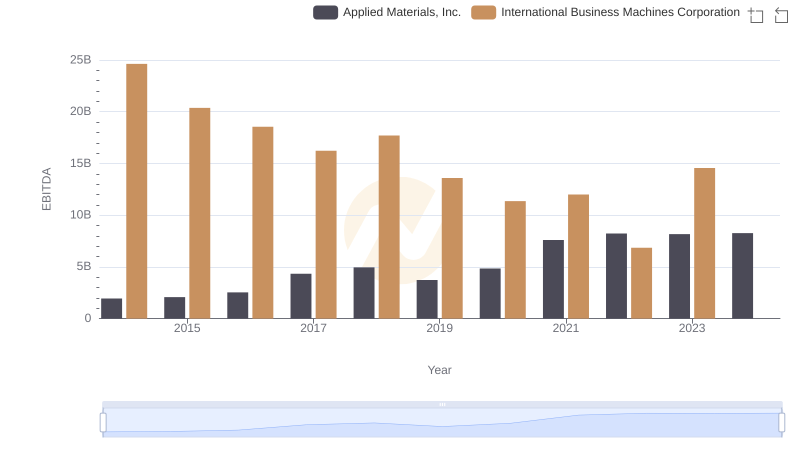
EBITDA Performance Review: International Business Machines Corporation vs Applied Materials, Inc.
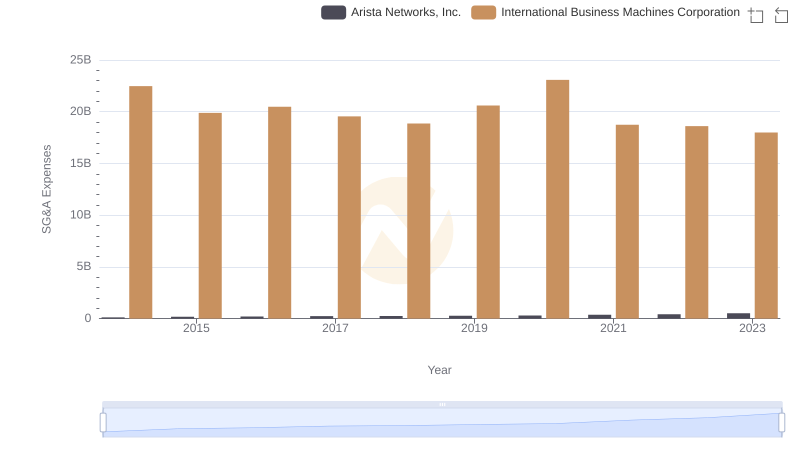
Comparing SG&A Expenses: International Business Machines Corporation vs Arista Networks, Inc. Trends and Insights
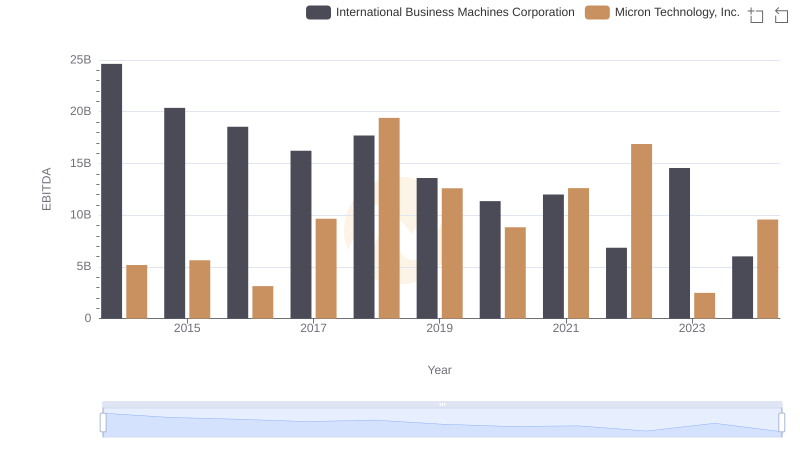
International Business Machines Corporation and Micron Technology, Inc.: A Detailed Examination of EBITDA Performance
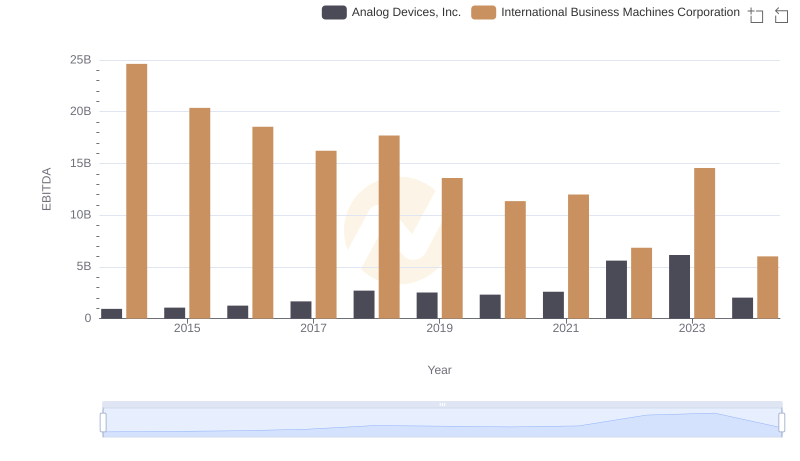
EBITDA Analysis: Evaluating International Business Machines Corporation Against Analog Devices, Inc.
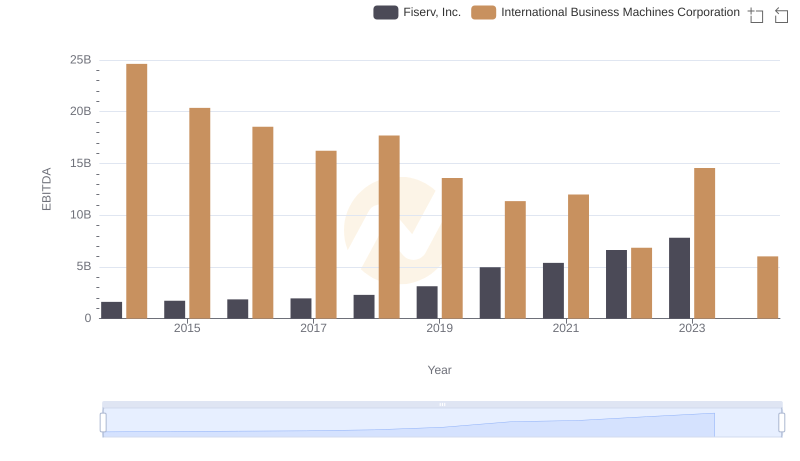
International Business Machines Corporation vs Fiserv, Inc.: In-Depth EBITDA Performance Comparison
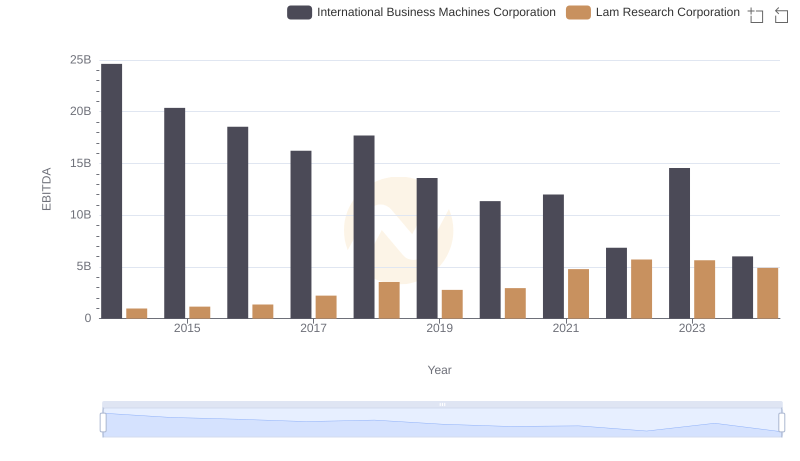
Professional EBITDA Benchmarking: International Business Machines Corporation vs Lam Research Corporation
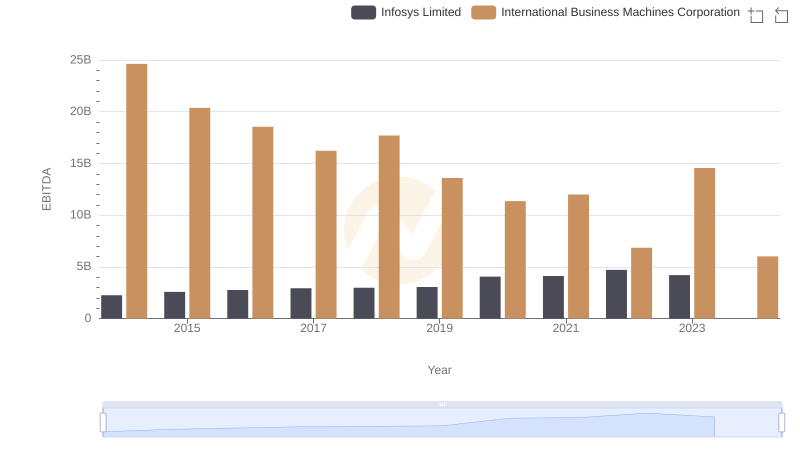
EBITDA Metrics Evaluated: International Business Machines Corporation vs Infosys Limited