| __timestamp | Arista Networks, Inc. | International Business Machines Corporation |
|---|---|---|
| Wednesday, January 1, 2014 | 584106000 | 92793000000 |
| Thursday, January 1, 2015 | 837591000 | 81742000000 |
| Friday, January 1, 2016 | 1129167000 | 79920000000 |
| Sunday, January 1, 2017 | 1646186000 | 79139000000 |
| Monday, January 1, 2018 | 2151369000 | 79591000000 |
| Tuesday, January 1, 2019 | 2410706000 | 57714000000 |
| Wednesday, January 1, 2020 | 2317512000 | 55179000000 |
| Friday, January 1, 2021 | 2948037000 | 57351000000 |
| Saturday, January 1, 2022 | 4381310000 | 60530000000 |
| Sunday, January 1, 2023 | 5860168000 | 61860000000 |
| Monday, January 1, 2024 | 7003146000 | 62753000000 |
Infusing magic into the data realm
In the ever-evolving landscape of technology, the financial trajectories of International Business Machines Corporation (IBM) and Arista Networks, Inc. offer a fascinating study. Over the past decade, IBM, a stalwart in the tech industry, has seen its annual revenue fluctuate, peaking in 2014 and experiencing a gradual decline thereafter. In contrast, Arista Networks, a relative newcomer, has demonstrated impressive growth, with its revenue increasing nearly tenfold from 2014 to 2023.
By 2023, Arista's revenue reached approximately 6 billion, marking a significant rise from its 2014 figure. Meanwhile, IBM's revenue, though still substantial, decreased by about 33% over the same period. This comparison highlights the dynamic nature of the tech industry, where innovation and agility can lead to rapid growth, even against established giants. As the digital age progresses, these trends underscore the importance of adaptability and foresight in maintaining competitive advantage.
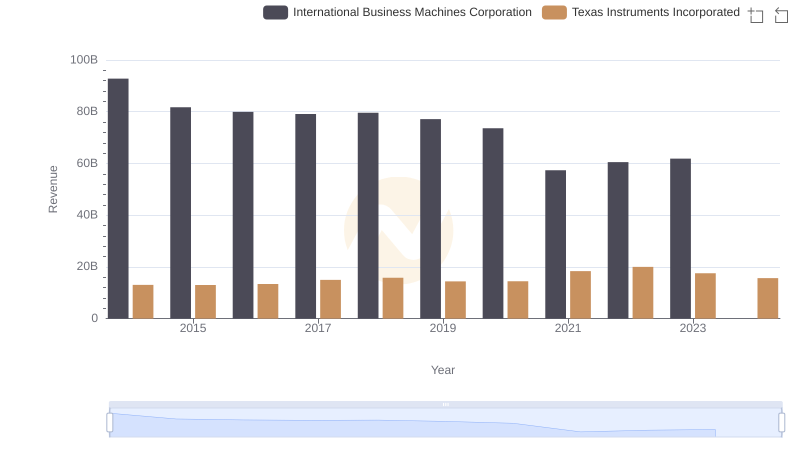
Annual Revenue Comparison: International Business Machines Corporation vs Texas Instruments Incorporated
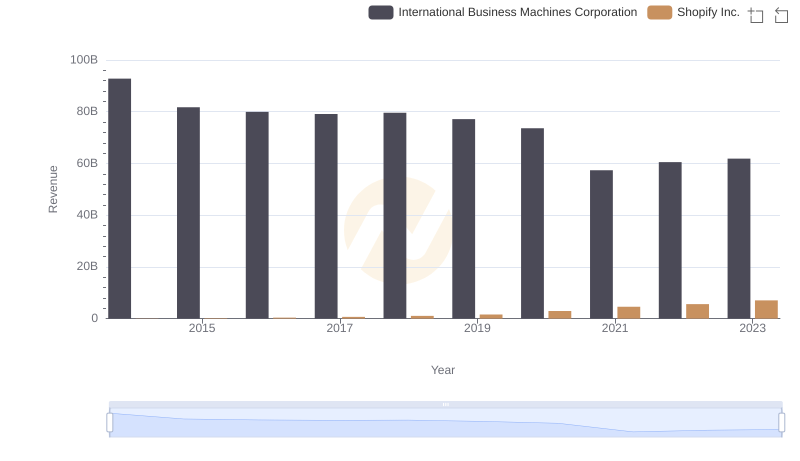
Comparing Revenue Performance: International Business Machines Corporation or Shopify Inc.?
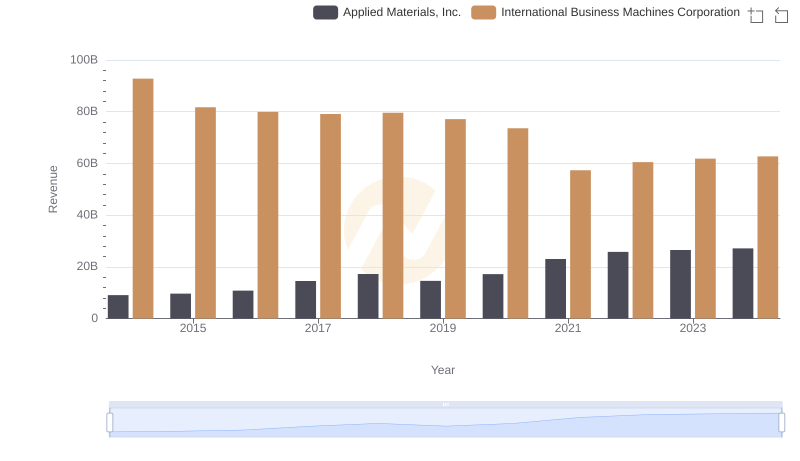
Comparing Revenue Performance: International Business Machines Corporation or Applied Materials, Inc.?
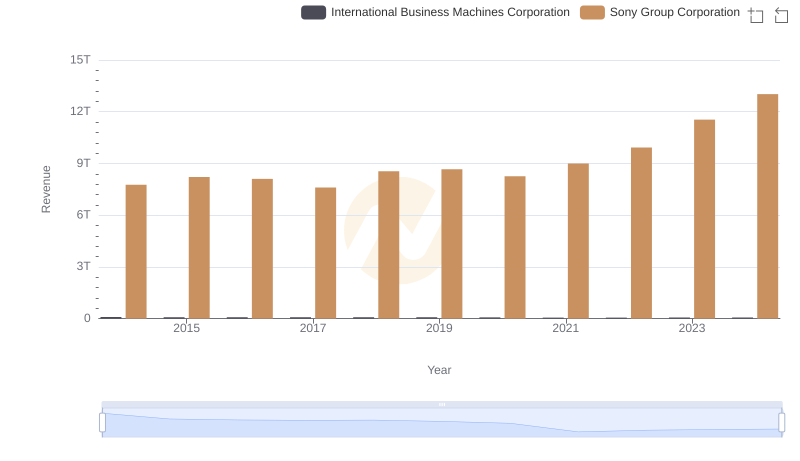
International Business Machines Corporation vs Sony Group Corporation: Annual Revenue Growth Compared
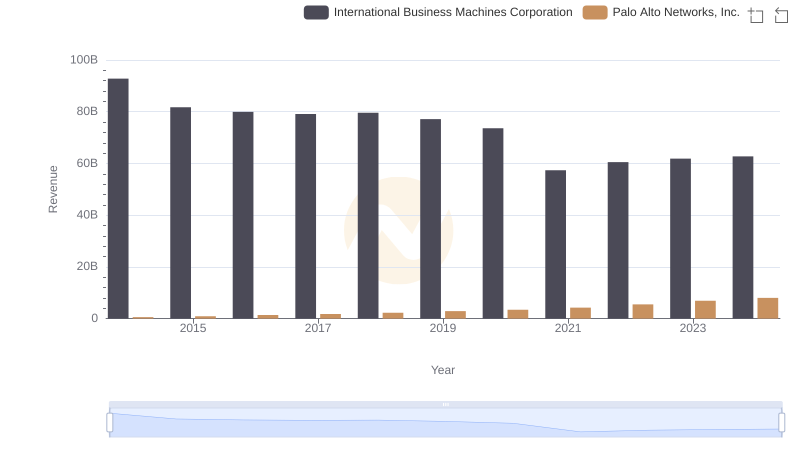
Revenue Insights: International Business Machines Corporation and Palo Alto Networks, Inc. Performance Compared
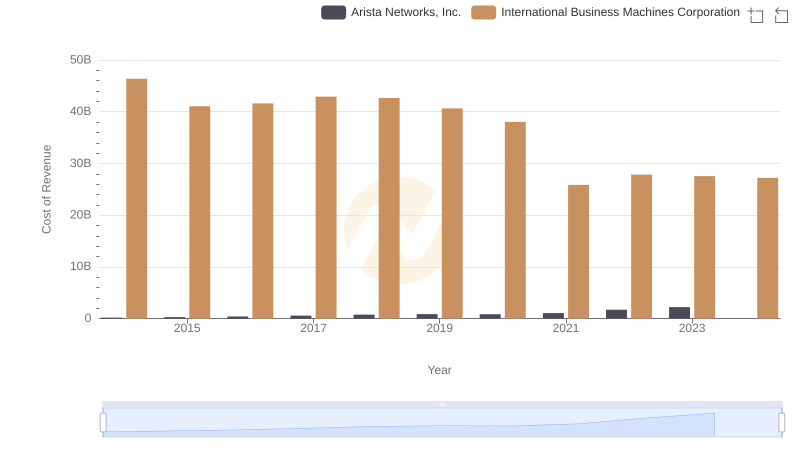
Analyzing Cost of Revenue: International Business Machines Corporation and Arista Networks, Inc.
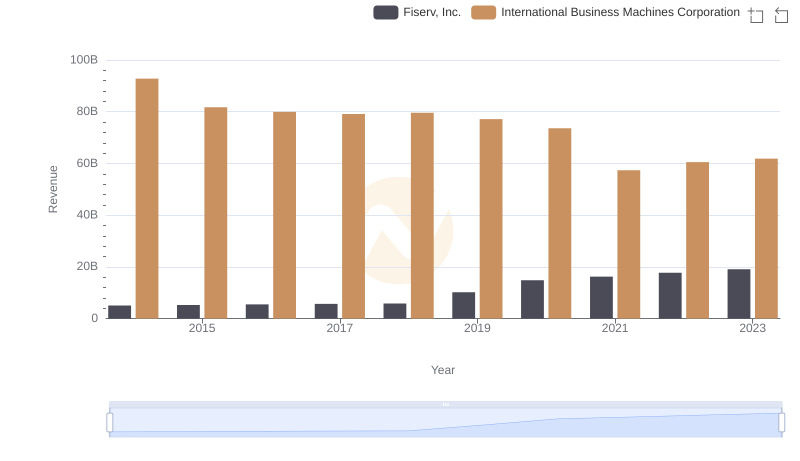
Breaking Down Revenue Trends: International Business Machines Corporation vs Fiserv, Inc.
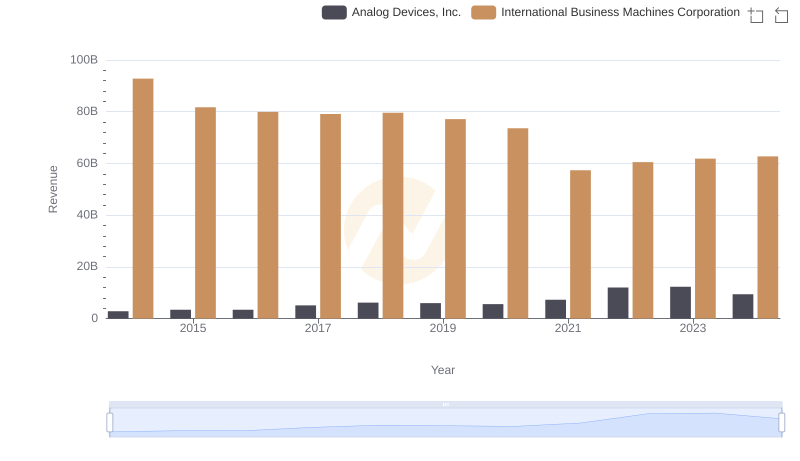
International Business Machines Corporation vs Analog Devices, Inc.: Examining Key Revenue Metrics
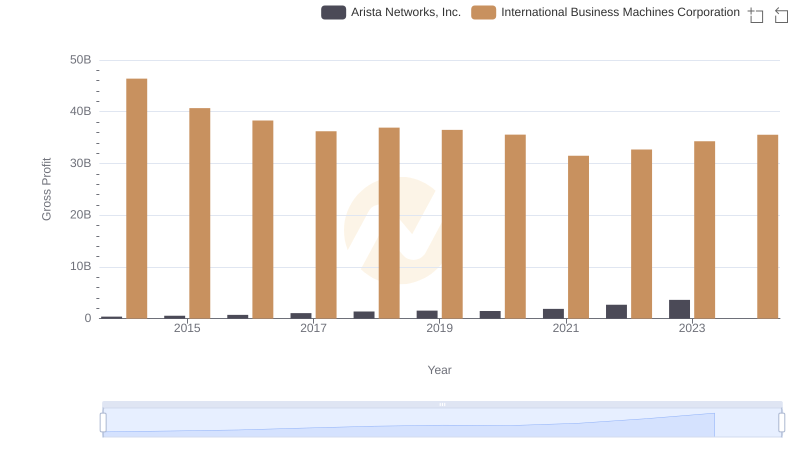
Who Generates Higher Gross Profit? International Business Machines Corporation or Arista Networks, Inc.
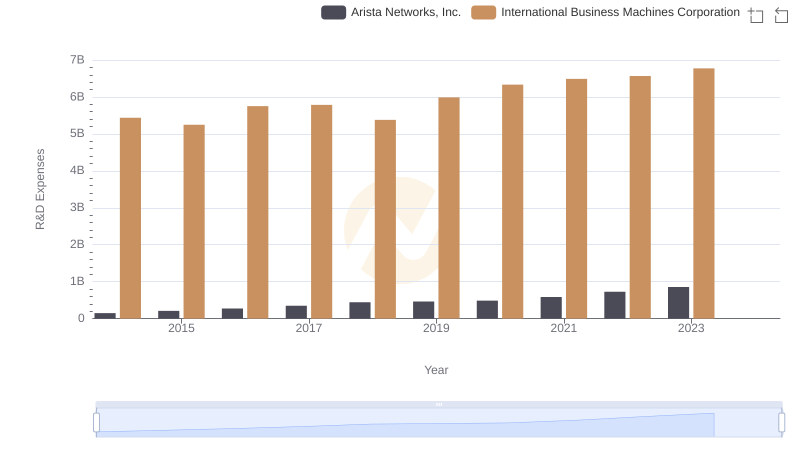
International Business Machines Corporation vs Arista Networks, Inc.: Strategic Focus on R&D Spending
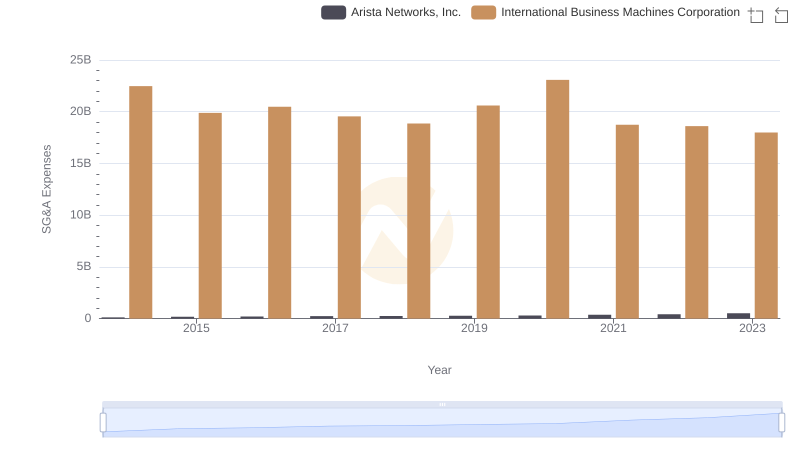
Comparing SG&A Expenses: International Business Machines Corporation vs Arista Networks, Inc. Trends and Insights
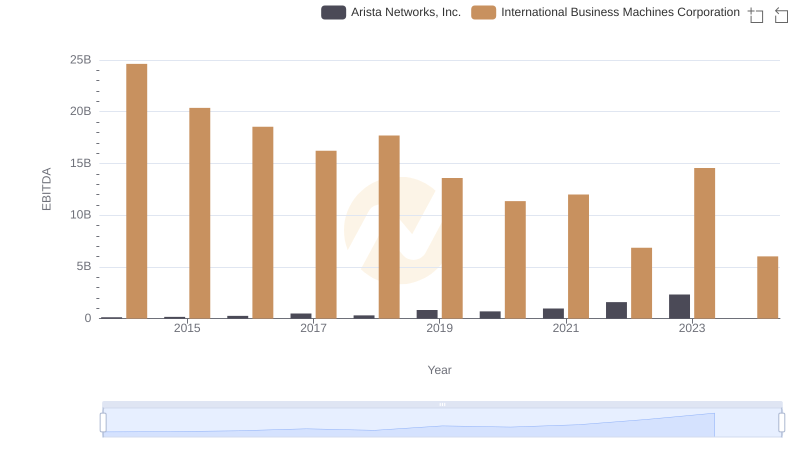
EBITDA Analysis: Evaluating International Business Machines Corporation Against Arista Networks, Inc.