| __timestamp | Arista Networks, Inc. | International Business Machines Corporation |
|---|---|---|
| Wednesday, January 1, 2014 | 192015000 | 46386000000 |
| Thursday, January 1, 2015 | 294031000 | 41057000000 |
| Friday, January 1, 2016 | 406051000 | 41403000000 |
| Sunday, January 1, 2017 | 584417000 | 42196000000 |
| Monday, January 1, 2018 | 777992000 | 42655000000 |
| Tuesday, January 1, 2019 | 866368000 | 26181000000 |
| Wednesday, January 1, 2020 | 835626000 | 24314000000 |
| Friday, January 1, 2021 | 1067258000 | 25865000000 |
| Saturday, January 1, 2022 | 1705614000 | 27842000000 |
| Sunday, January 1, 2023 | 2229887000 | 27560000000 |
| Monday, January 1, 2024 | 2511843000 | 27202000000 |
Data in motion
In the ever-evolving tech industry, understanding cost structures is crucial. This analysis delves into the cost of revenue for two giants: International Business Machines Corporation (IBM) and Arista Networks, Inc., from 2014 to 2023. IBM, a stalwart in the tech world, consistently reported a cost of revenue around $36 billion annually, peaking in 2014. In contrast, Arista Networks, a rising star, saw its cost of revenue grow by over 1,000% during the same period, reflecting its rapid expansion and market penetration.
While IBM's cost of revenue decreased by approximately 40% from 2014 to 2023, Arista's surged, highlighting its aggressive growth strategy. Notably, data for Arista in 2024 is missing, indicating potential reporting delays or strategic shifts. This comparison underscores the dynamic nature of tech companies' financial strategies and their impact on market positioning.
Stay tuned for more insights into the financial dynamics of leading tech firms.
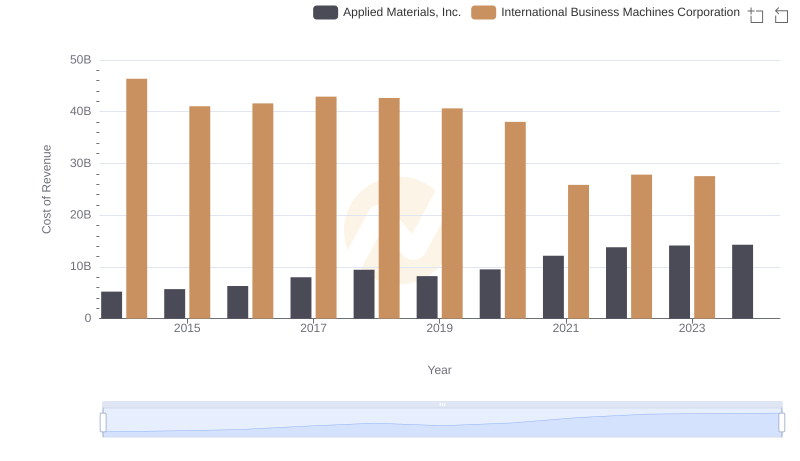
Cost of Revenue: Key Insights for International Business Machines Corporation and Applied Materials, Inc.
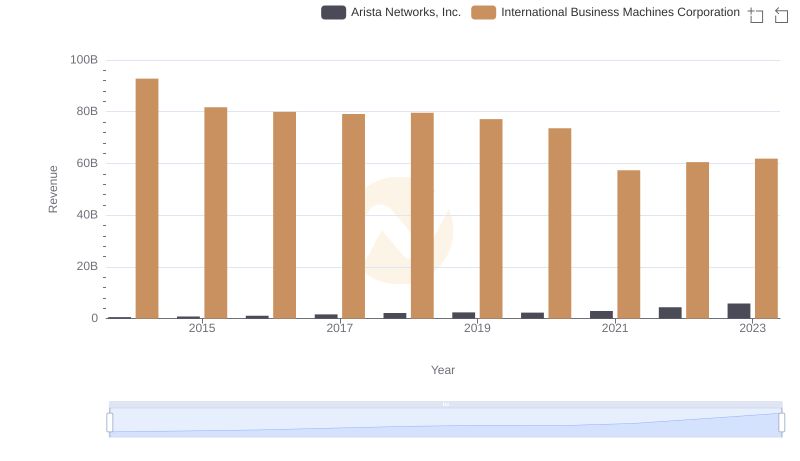
Annual Revenue Comparison: International Business Machines Corporation vs Arista Networks, Inc.
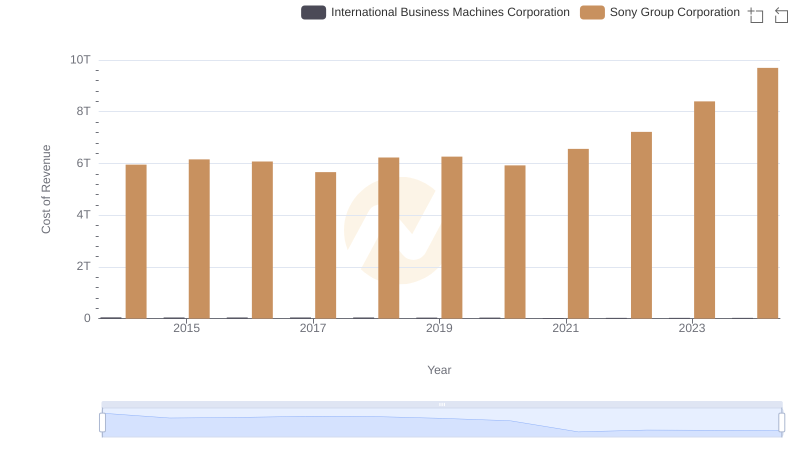
Cost of Revenue: Key Insights for International Business Machines Corporation and Sony Group Corporation
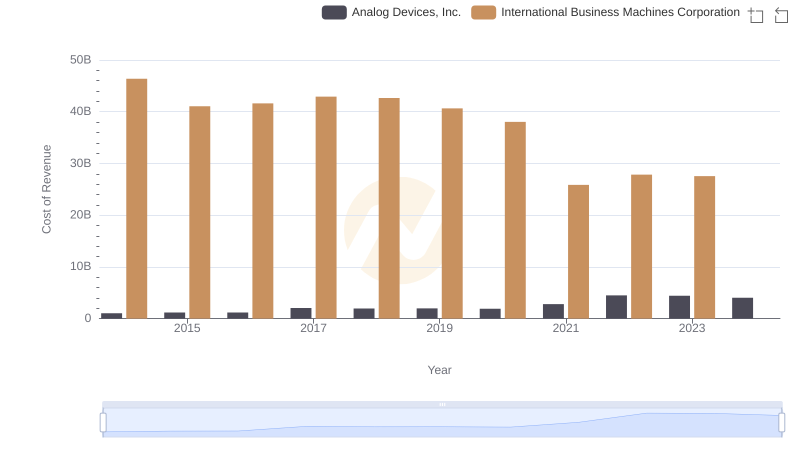
Comparing Cost of Revenue Efficiency: International Business Machines Corporation vs Analog Devices, Inc.
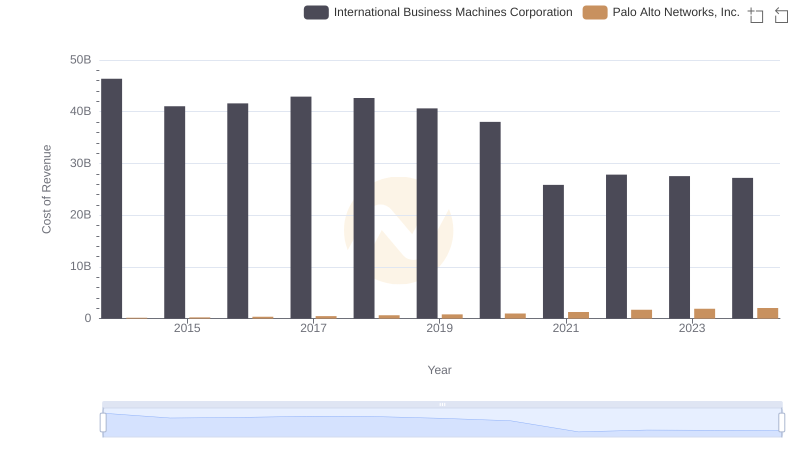
Comparing Cost of Revenue Efficiency: International Business Machines Corporation vs Palo Alto Networks, Inc.
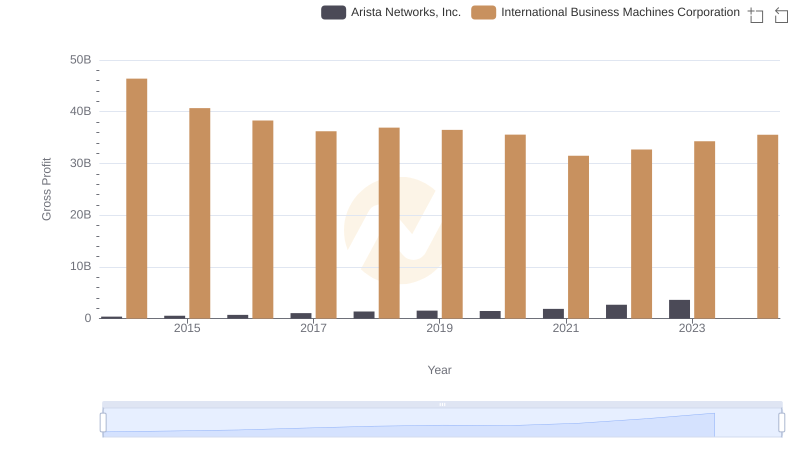
Who Generates Higher Gross Profit? International Business Machines Corporation or Arista Networks, Inc.
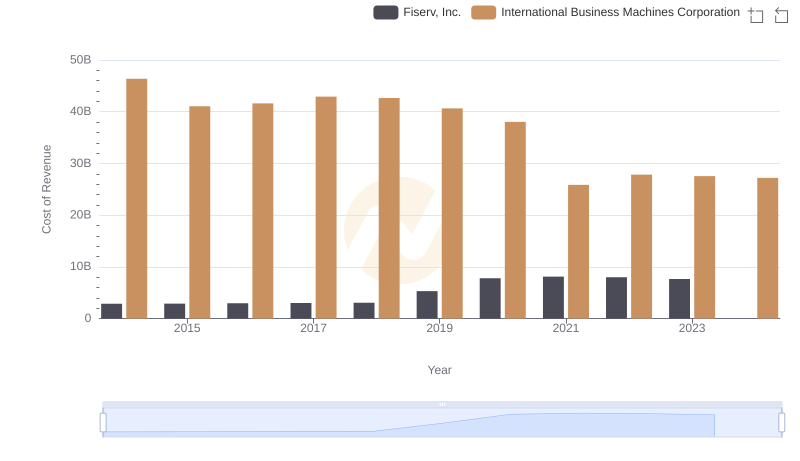
Analyzing Cost of Revenue: International Business Machines Corporation and Fiserv, Inc.
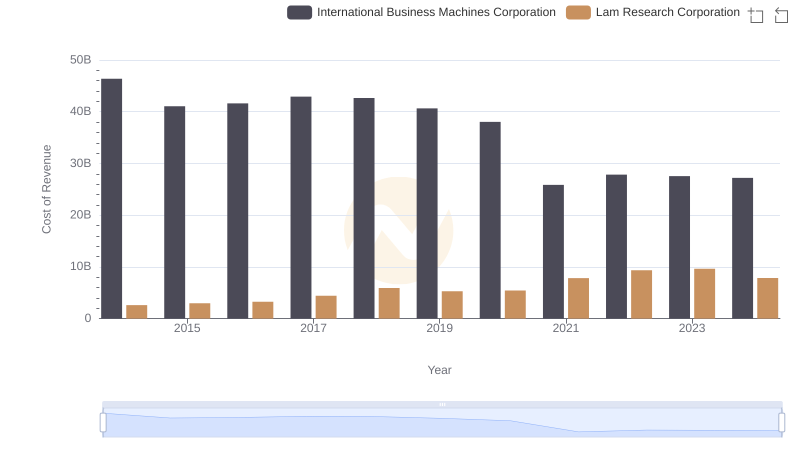
Analyzing Cost of Revenue: International Business Machines Corporation and Lam Research Corporation
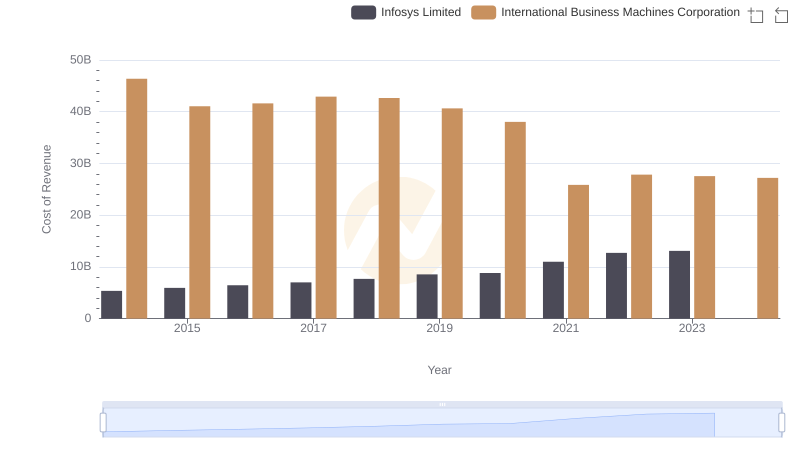
International Business Machines Corporation vs Infosys Limited: Efficiency in Cost of Revenue Explored
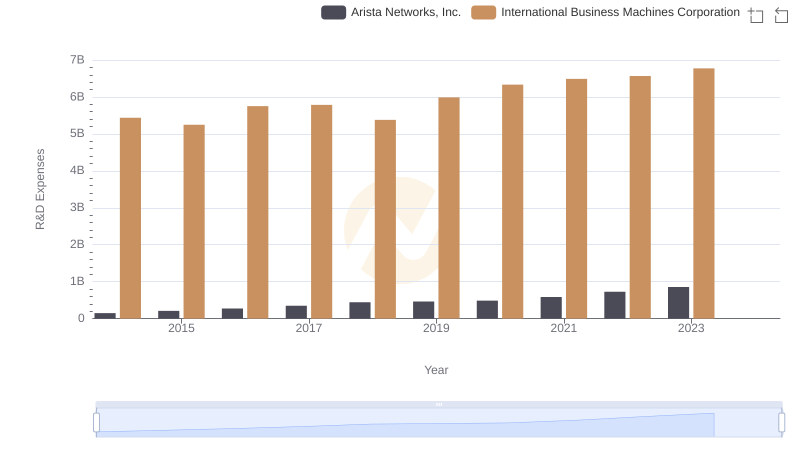
International Business Machines Corporation vs Arista Networks, Inc.: Strategic Focus on R&D Spending
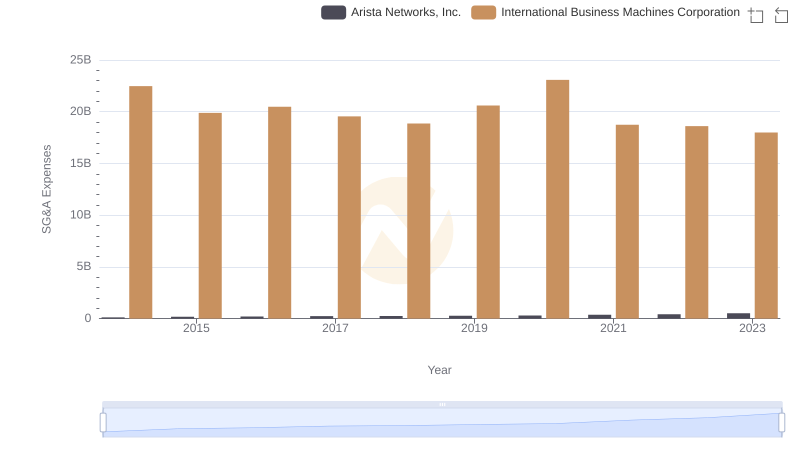
Comparing SG&A Expenses: International Business Machines Corporation vs Arista Networks, Inc. Trends and Insights
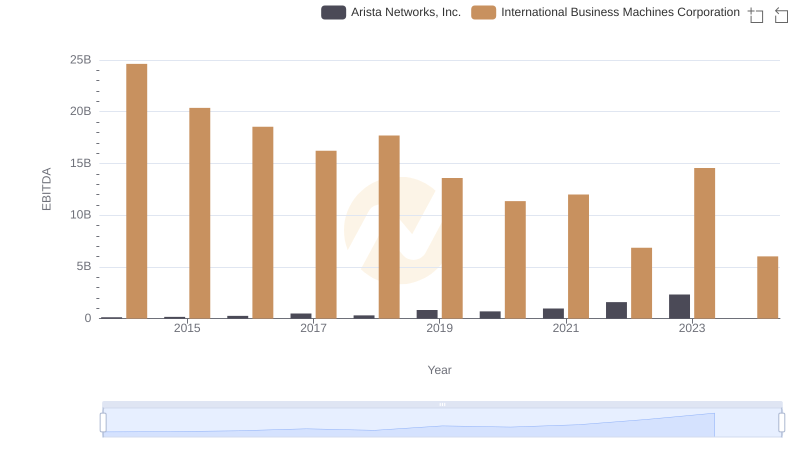
EBITDA Analysis: Evaluating International Business Machines Corporation Against Arista Networks, Inc.