| __timestamp | Arista Networks, Inc. | International Business Machines Corporation |
|---|---|---|
| Wednesday, January 1, 2014 | 117669000 | 22472000000 |
| Thursday, January 1, 2015 | 184804000 | 19894000000 |
| Friday, January 1, 2016 | 206126000 | 20279000000 |
| Sunday, January 1, 2017 | 241903000 | 19680000000 |
| Monday, January 1, 2018 | 252562000 | 19366000000 |
| Tuesday, January 1, 2019 | 275805000 | 18724000000 |
| Wednesday, January 1, 2020 | 295608000 | 20561000000 |
| Friday, January 1, 2021 | 369288000 | 18745000000 |
| Saturday, January 1, 2022 | 420196000 | 17483000000 |
| Sunday, January 1, 2023 | 518114000 | 17997000000 |
| Monday, January 1, 2024 | 549970000 | 29536000000 |
Cracking the code
In the ever-evolving landscape of technology, understanding the financial strategies of industry leaders is crucial. This analysis delves into the Selling, General, and Administrative (SG&A) expenses of two tech titans: International Business Machines Corporation (IBM) and Arista Networks, Inc., from 2014 to 2023.
IBM, a stalwart in the tech industry, has consistently allocated a significant portion of its budget to SG&A expenses, averaging around $20 billion annually. This reflects IBM's commitment to maintaining its market position through strategic investments in sales and administration.
In contrast, Arista Networks, a relative newcomer, has shown a remarkable upward trend in SG&A expenses, growing by over 340% from 2014 to 2023. This surge underscores Arista's aggressive expansion strategy, aiming to capture a larger market share.
While the data for 2024 is incomplete, the trends observed provide valuable insights into the strategic priorities of these companies.
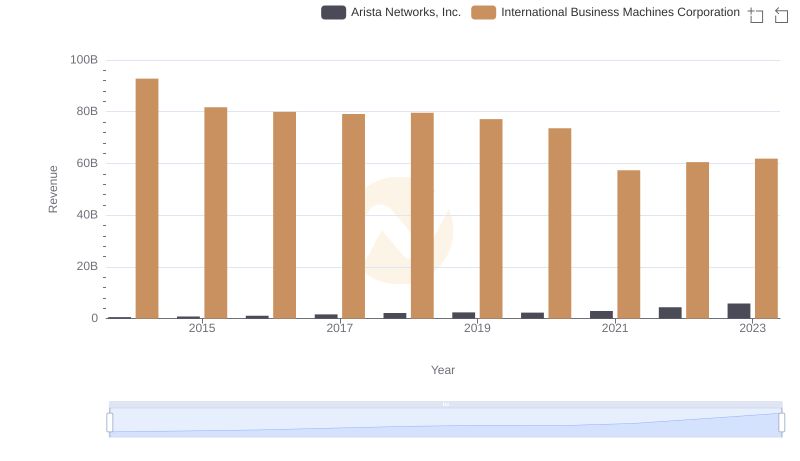
Annual Revenue Comparison: International Business Machines Corporation vs Arista Networks, Inc.
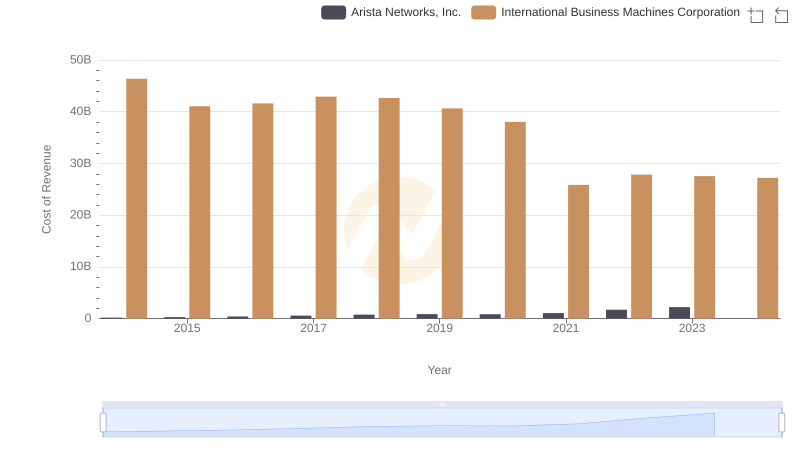
Analyzing Cost of Revenue: International Business Machines Corporation and Arista Networks, Inc.
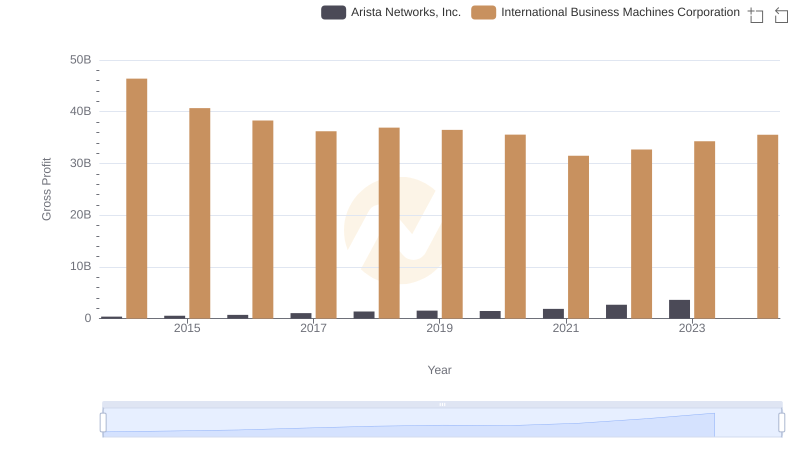
Who Generates Higher Gross Profit? International Business Machines Corporation or Arista Networks, Inc.
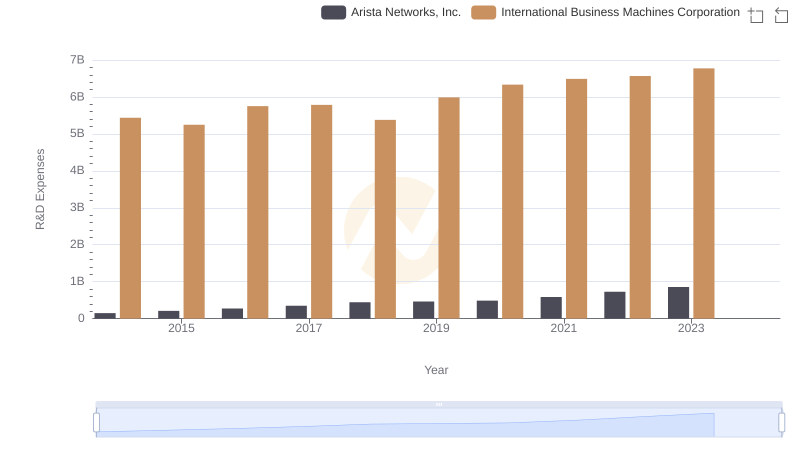
International Business Machines Corporation vs Arista Networks, Inc.: Strategic Focus on R&D Spending
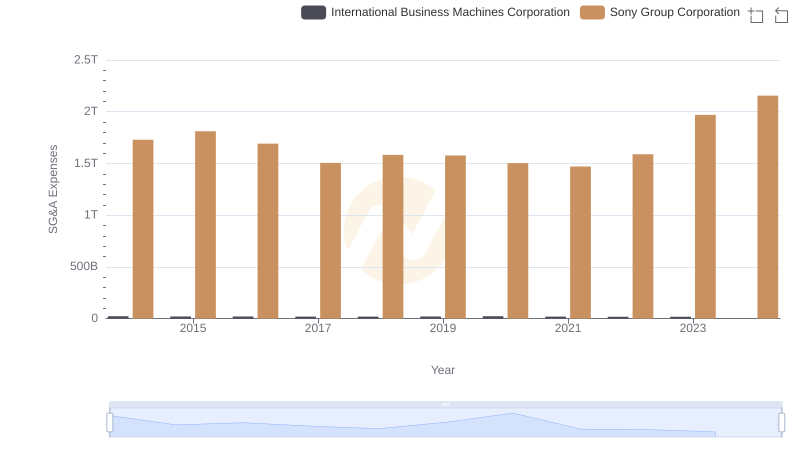
Who Optimizes SG&A Costs Better? International Business Machines Corporation or Sony Group Corporation
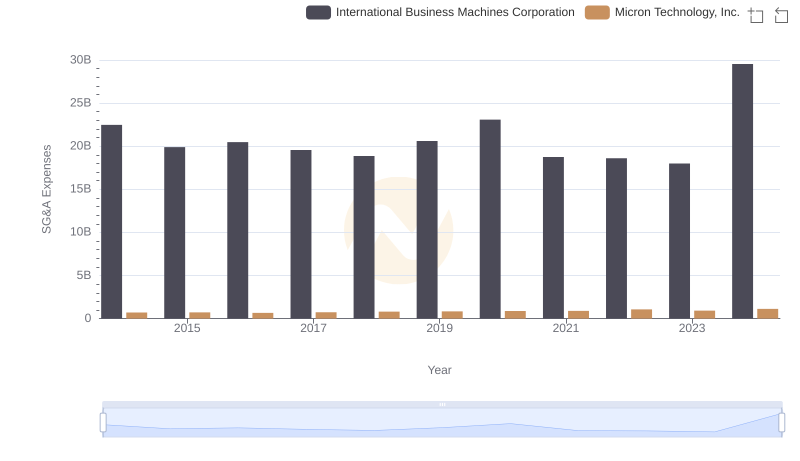
Operational Costs Compared: SG&A Analysis of International Business Machines Corporation and Micron Technology, Inc.
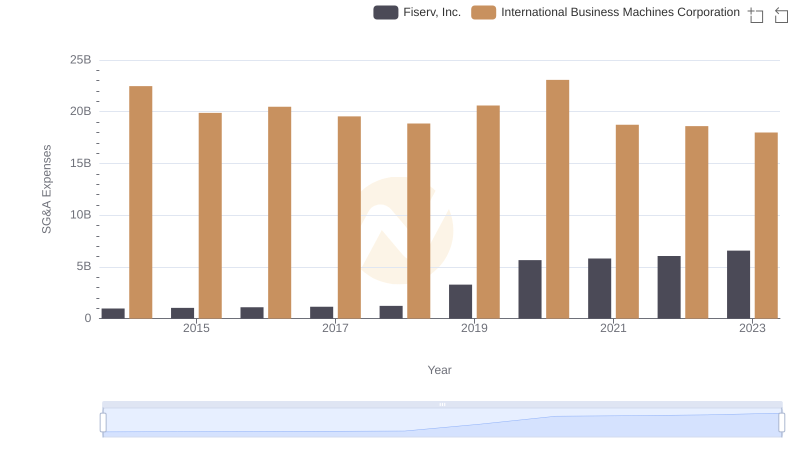
Comparing SG&A Expenses: International Business Machines Corporation vs Fiserv, Inc. Trends and Insights
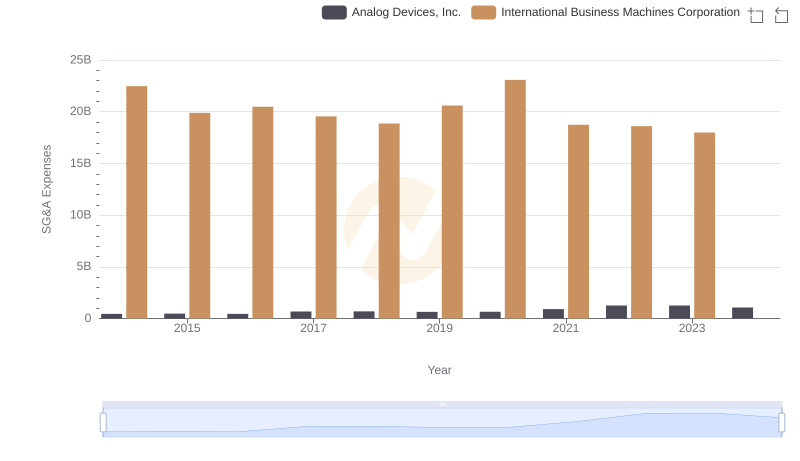
SG&A Efficiency Analysis: Comparing International Business Machines Corporation and Analog Devices, Inc.
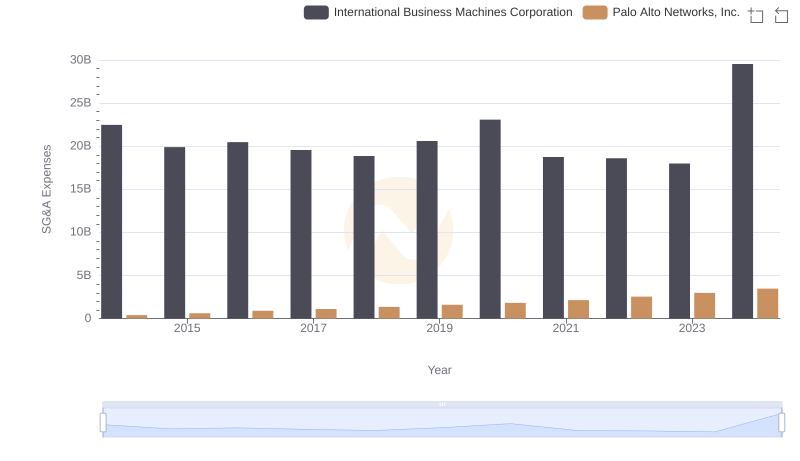
Breaking Down SG&A Expenses: International Business Machines Corporation vs Palo Alto Networks, Inc.
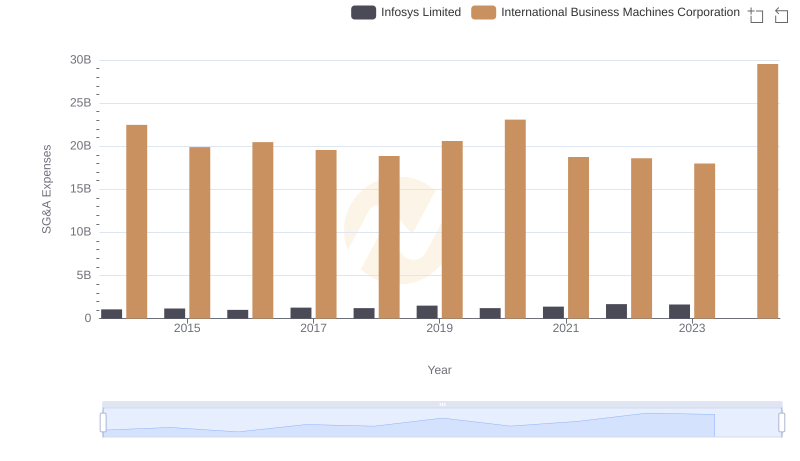
SG&A Efficiency Analysis: Comparing International Business Machines Corporation and Infosys Limited
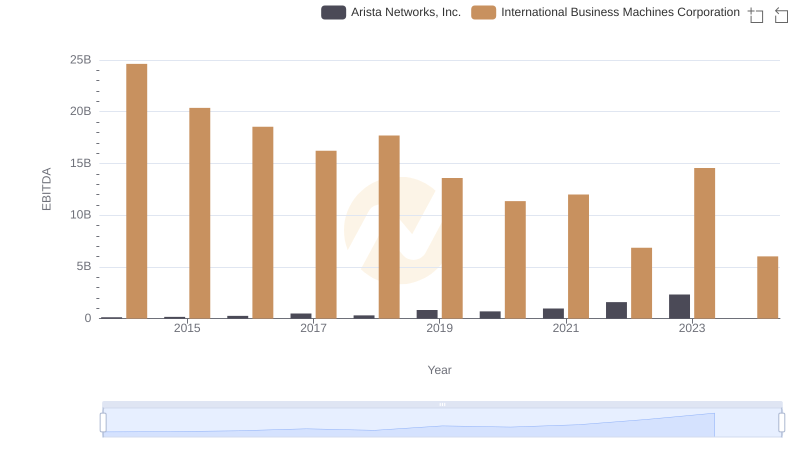
EBITDA Analysis: Evaluating International Business Machines Corporation Against Arista Networks, Inc.