| __timestamp | International Business Machines Corporation | Micron Technology, Inc. |
|---|---|---|
| Wednesday, January 1, 2014 | 24962000000 | 5188000000 |
| Thursday, January 1, 2015 | 20268000000 | 5647000000 |
| Friday, January 1, 2016 | 17341000000 | 3136000000 |
| Sunday, January 1, 2017 | 16556000000 | 9658000000 |
| Monday, January 1, 2018 | 16545000000 | 19408000000 |
| Tuesday, January 1, 2019 | 14609000000 | 12600000000 |
| Wednesday, January 1, 2020 | 10555000000 | 8827000000 |
| Friday, January 1, 2021 | 12409000000 | 12615000000 |
| Saturday, January 1, 2022 | 7174000000 | 16876000000 |
| Sunday, January 1, 2023 | 14693000000 | 2486000000 |
| Monday, January 1, 2024 | 6015000000 | 9582000000 |
Unleashing insights
In the ever-evolving landscape of technology, International Business Machines Corporation (IBM) and Micron Technology, Inc. have been pivotal players. From 2014 to 2024, their EBITDA performance reveals intriguing trends. IBM, a stalwart in the industry, saw its EBITDA peak in 2014, only to experience a gradual decline, reaching its lowest in 2024. This represents a staggering 76% drop over the decade.
Conversely, Micron Technology, a leader in memory and storage solutions, showcased a more volatile yet upward trajectory. From a modest start in 2014, Micron's EBITDA surged by over 80% by 2022, before experiencing fluctuations. This dynamic shift underscores the contrasting strategies and market responses of these tech titans.
As we delve into these financial narratives, the data not only highlights the resilience and adaptability of these companies but also offers a glimpse into the broader technological and economic shifts shaping the industry.
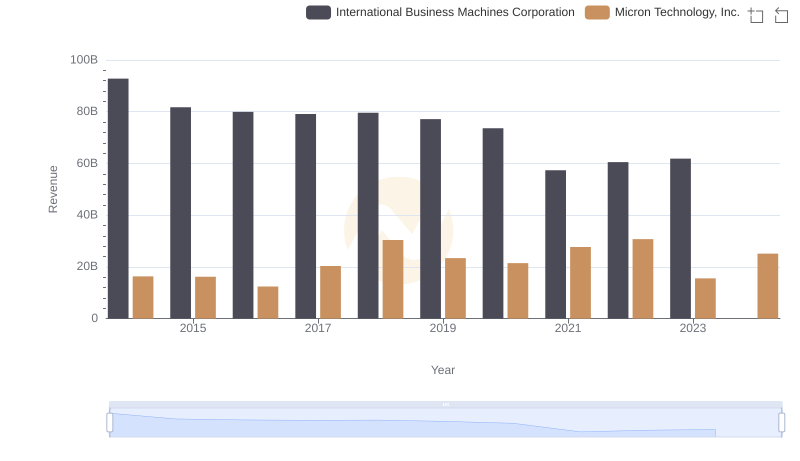
International Business Machines Corporation vs Micron Technology, Inc.: Examining Key Revenue Metrics
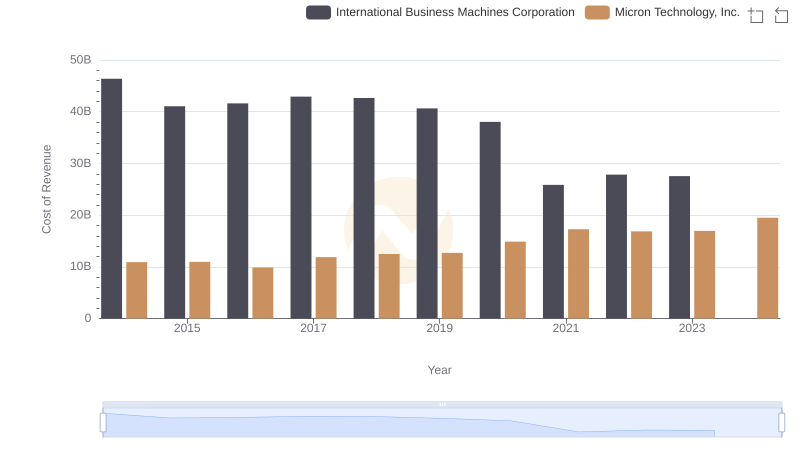
Cost of Revenue: Key Insights for International Business Machines Corporation and Micron Technology, Inc.
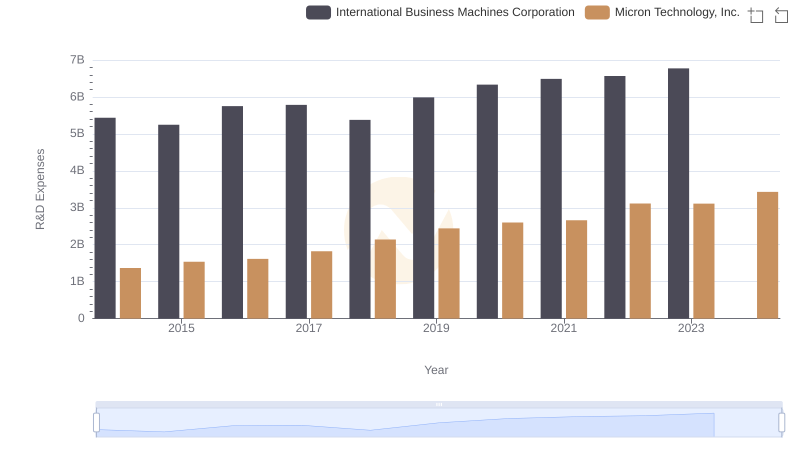
Who Prioritizes Innovation? R&D Spending Compared for International Business Machines Corporation and Micron Technology, Inc.
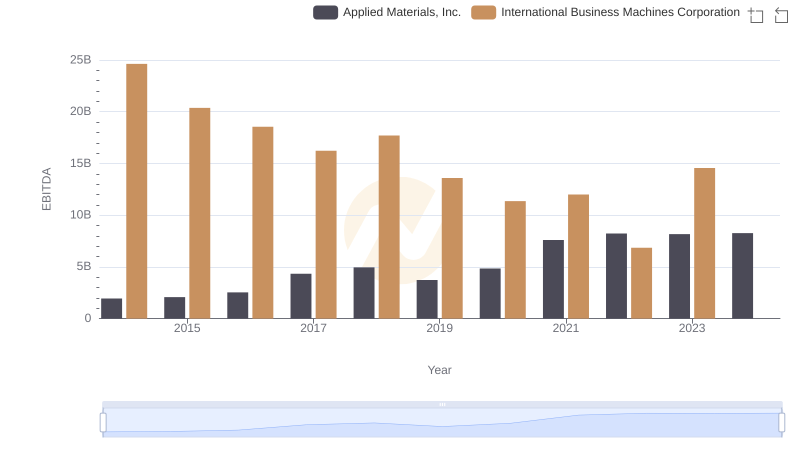
EBITDA Performance Review: International Business Machines Corporation vs Applied Materials, Inc.
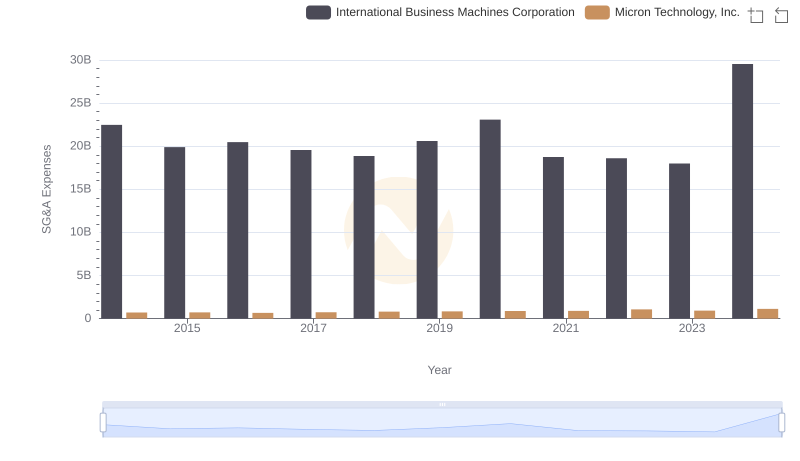
Operational Costs Compared: SG&A Analysis of International Business Machines Corporation and Micron Technology, Inc.
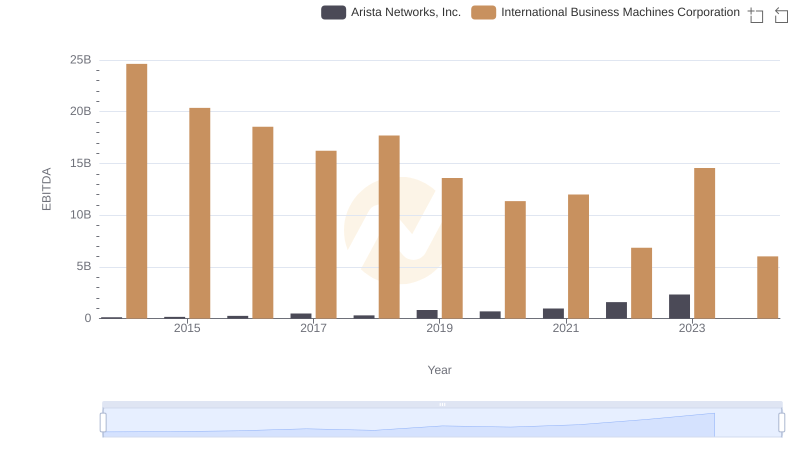
EBITDA Analysis: Evaluating International Business Machines Corporation Against Arista Networks, Inc.
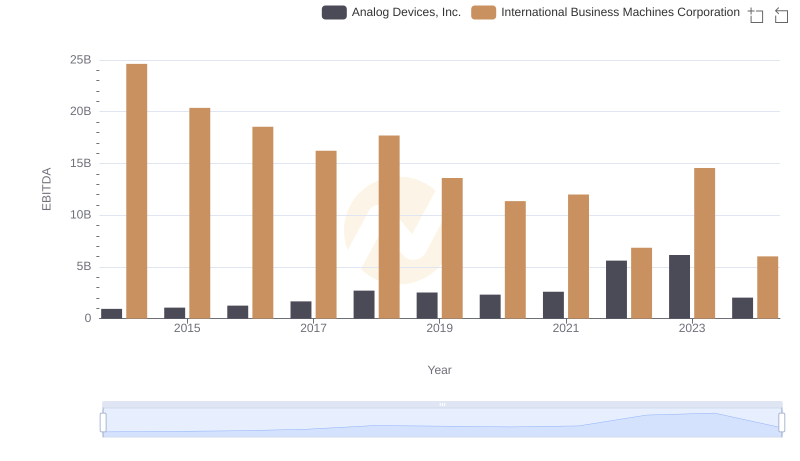
EBITDA Analysis: Evaluating International Business Machines Corporation Against Analog Devices, Inc.
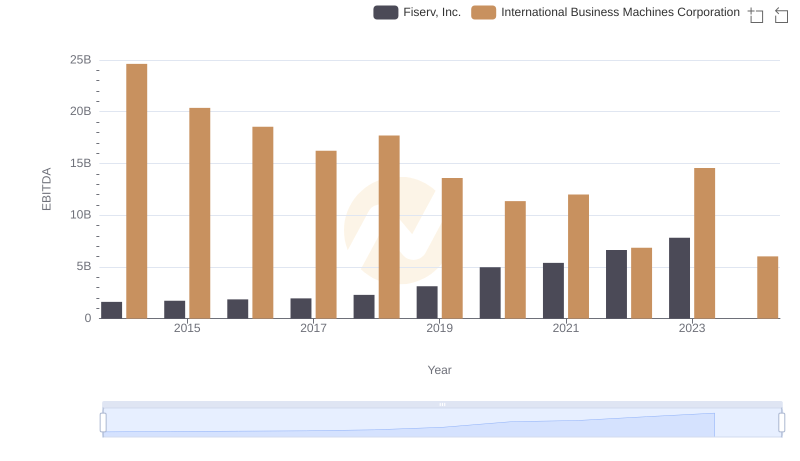
International Business Machines Corporation vs Fiserv, Inc.: In-Depth EBITDA Performance Comparison
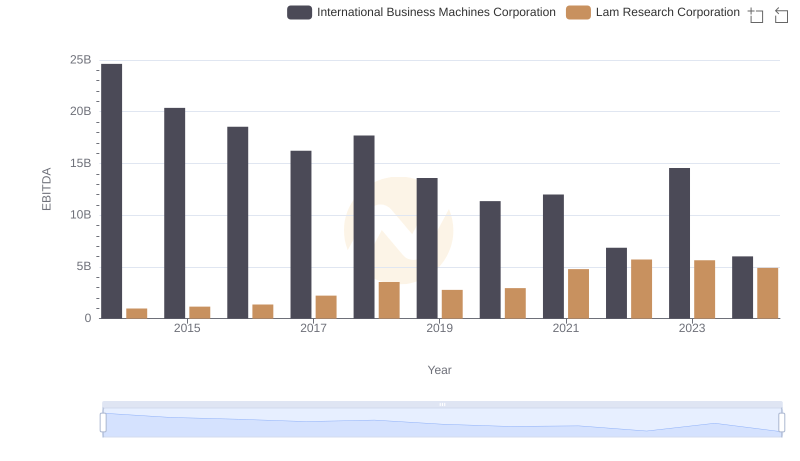
Professional EBITDA Benchmarking: International Business Machines Corporation vs Lam Research Corporation
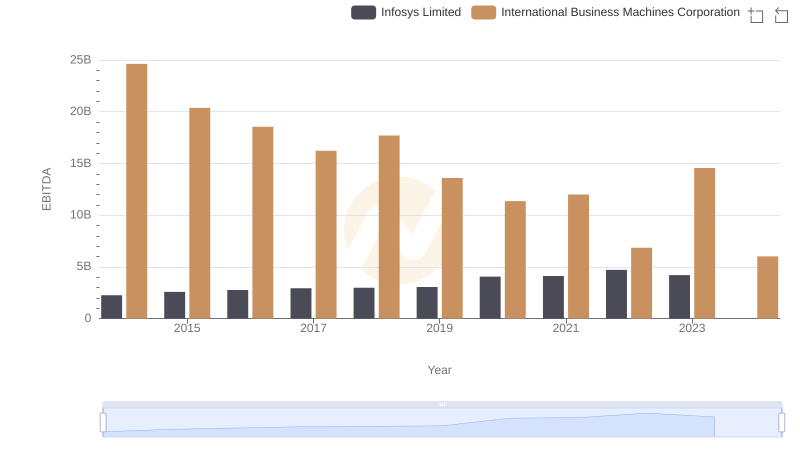
EBITDA Metrics Evaluated: International Business Machines Corporation vs Infosys Limited
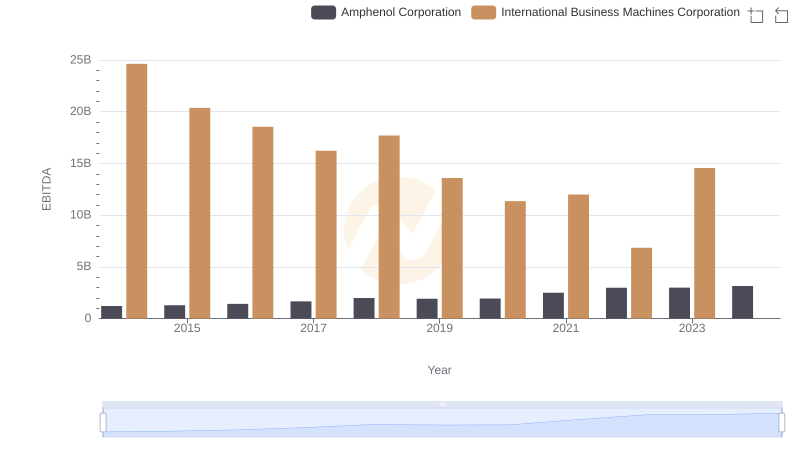
A Side-by-Side Analysis of EBITDA: International Business Machines Corporation and Amphenol Corporation