| __timestamp | AMETEK, Inc. | ZTO Express (Cayman) Inc. |
|---|---|---|
| Wednesday, January 1, 2014 | 1023344000 | 876815000 |
| Thursday, January 1, 2015 | 1093776000 | 1687285000 |
| Friday, January 1, 2016 | 1007213000 | 3093956000 |
| Sunday, January 1, 2017 | 1068174000 | 4308801000 |
| Monday, January 1, 2018 | 1269415000 | 5185941000 |
| Tuesday, January 1, 2019 | 1411422000 | 6727397000 |
| Wednesday, January 1, 2020 | 1283159000 | 5197064000 |
| Friday, January 1, 2021 | 1600782000 | 5866901000 |
| Saturday, January 1, 2022 | 1820119000 | 11147519000 |
| Sunday, January 1, 2023 | 2025843000 | 13853443000 |
| Monday, January 1, 2024 | 1779562000 |
Data in motion
In the ever-evolving landscape of global business, the financial performance of companies is a key indicator of their market prowess. This analysis delves into the EBITDA trends of two industry titans: AMETEK, Inc., a leader in electronic instruments, and ZTO Express (Cayman) Inc., a major player in the logistics sector. From 2014 to 2023, AMETEK's EBITDA grew by approximately 98%, showcasing its steady expansion and resilience. Meanwhile, ZTO Express experienced a staggering 1,480% increase, reflecting its rapid growth in the booming e-commerce market. By 2023, ZTO's EBITDA was nearly seven times that of AMETEK, highlighting its dominant position in the logistics industry. This comparison not only underscores the dynamic nature of these sectors but also offers valuable insights into the strategic maneuvers that have propelled these companies to the forefront of their respective fields.
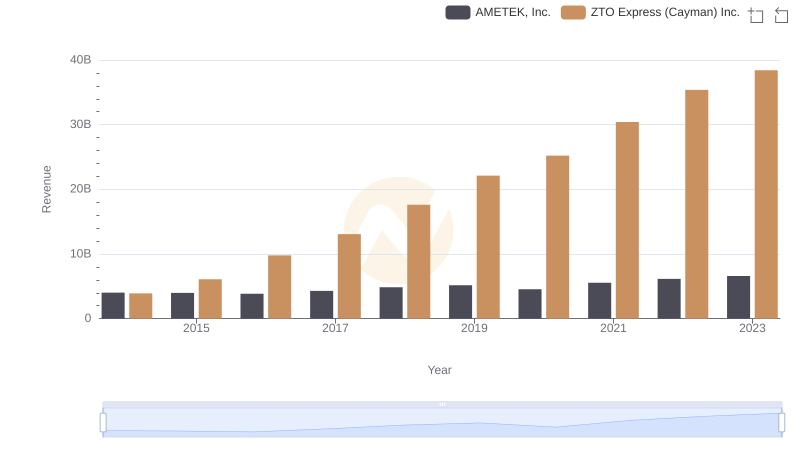
AMETEK, Inc. and ZTO Express (Cayman) Inc.: A Comprehensive Revenue Analysis
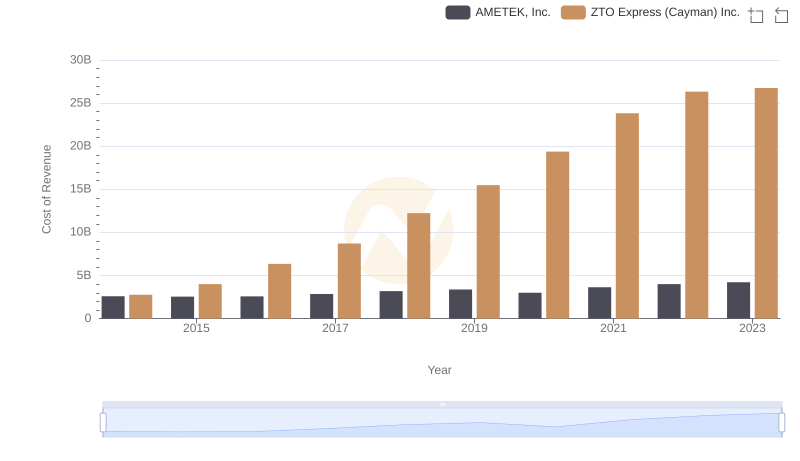
Cost Insights: Breaking Down AMETEK, Inc. and ZTO Express (Cayman) Inc.'s Expenses
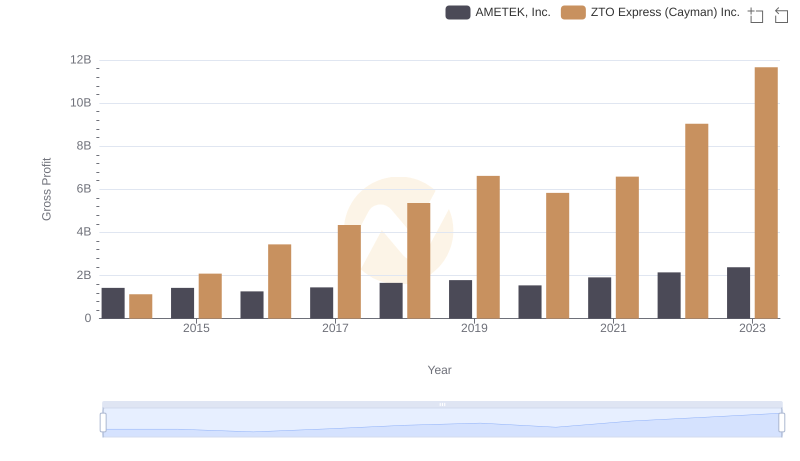
Gross Profit Comparison: AMETEK, Inc. and ZTO Express (Cayman) Inc. Trends
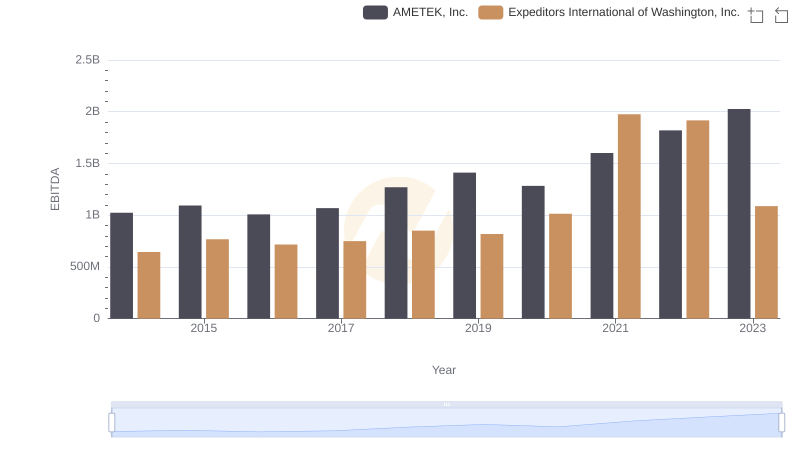
AMETEK, Inc. and Expeditors International of Washington, Inc.: A Detailed Examination of EBITDA Performance
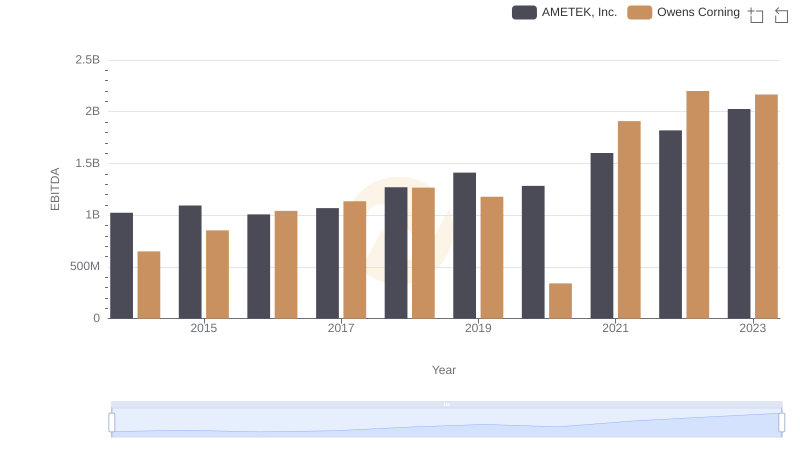
EBITDA Performance Review: AMETEK, Inc. vs Owens Corning
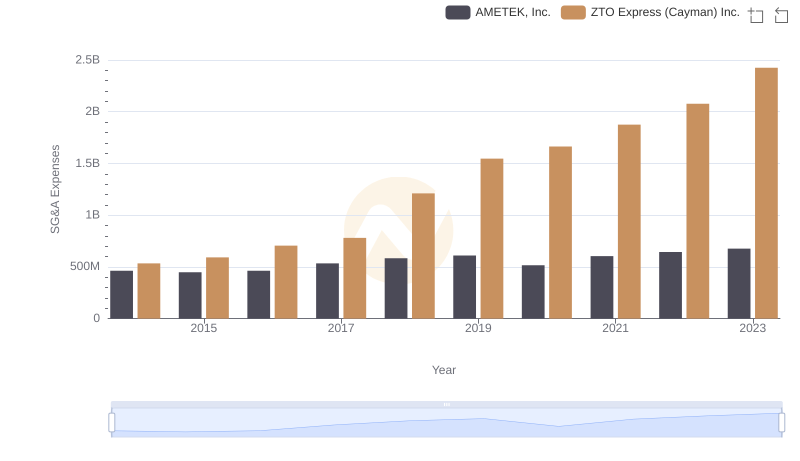
AMETEK, Inc. or ZTO Express (Cayman) Inc.: Who Manages SG&A Costs Better?
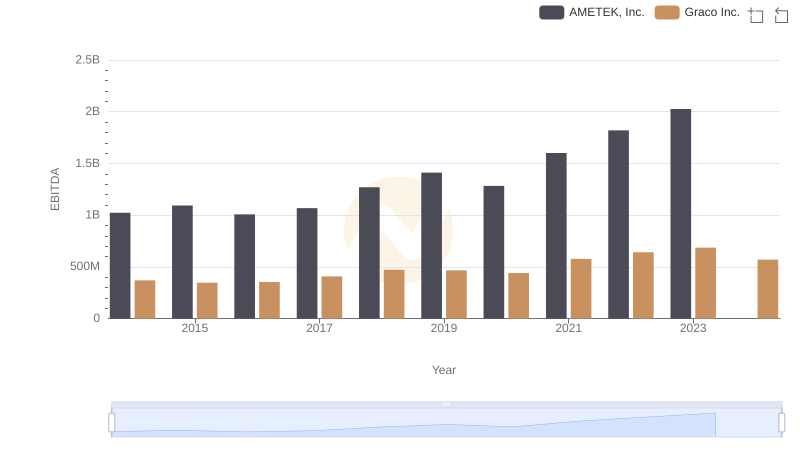
AMETEK, Inc. and Graco Inc.: A Detailed Examination of EBITDA Performance
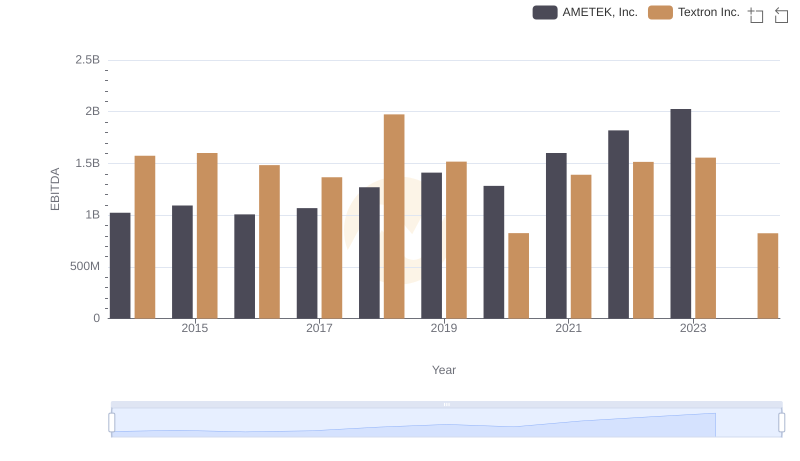
A Professional Review of EBITDA: AMETEK, Inc. Compared to Textron Inc.
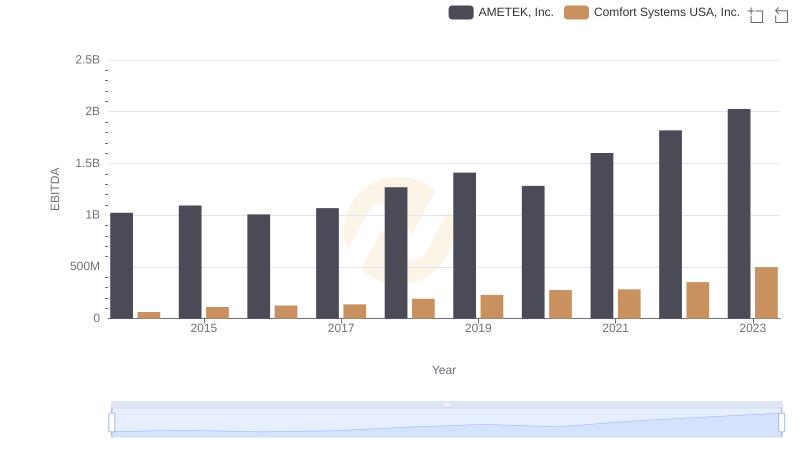
A Side-by-Side Analysis of EBITDA: AMETEK, Inc. and Comfort Systems USA, Inc.
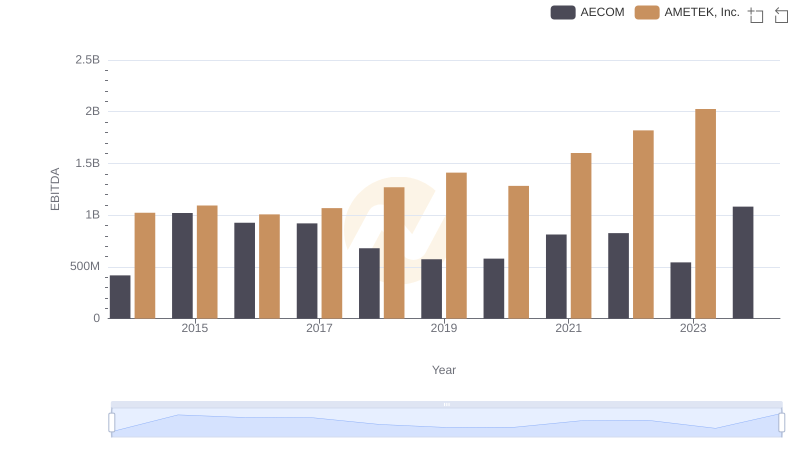
AMETEK, Inc. and AECOM: A Detailed Examination of EBITDA Performance