| __timestamp | AMETEK, Inc. | Owens Corning |
|---|---|---|
| Wednesday, January 1, 2014 | 1023344000 | 650000000 |
| Thursday, January 1, 2015 | 1093776000 | 853000000 |
| Friday, January 1, 2016 | 1007213000 | 1041000000 |
| Sunday, January 1, 2017 | 1068174000 | 1134000000 |
| Monday, January 1, 2018 | 1269415000 | 1266000000 |
| Tuesday, January 1, 2019 | 1411422000 | 1178000000 |
| Wednesday, January 1, 2020 | 1283159000 | 341000000 |
| Friday, January 1, 2021 | 1600782000 | 1909000000 |
| Saturday, January 1, 2022 | 1820119000 | 2200000000 |
| Sunday, January 1, 2023 | 2025843000 | 2166000000 |
| Monday, January 1, 2024 | 1779562000 |
Infusing magic into the data realm
In the ever-evolving landscape of industrial manufacturing, AMETEK, Inc. and Owens Corning have emerged as formidable players. Over the past decade, from 2014 to 2023, both companies have demonstrated impressive EBITDA growth, a key indicator of financial health and operational efficiency.
AMETEK, Inc. has shown a consistent upward trajectory, with its EBITDA growing by approximately 98% over the period. Starting at around $1 billion in 2014, it reached over $2 billion by 2023, reflecting a robust growth strategy and operational excellence.
Owens Corning, despite a dip in 2020, rebounded strongly, achieving a remarkable 233% increase in EBITDA from 2014 to 2023. This recovery underscores its resilience and adaptability in a competitive market.
Both companies exemplify strategic growth and resilience, setting benchmarks in the industrial sector.
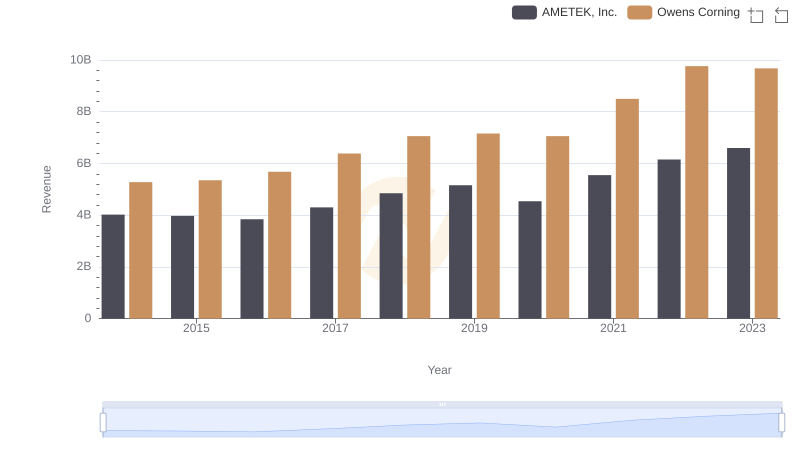
AMETEK, Inc. or Owens Corning: Who Leads in Yearly Revenue?
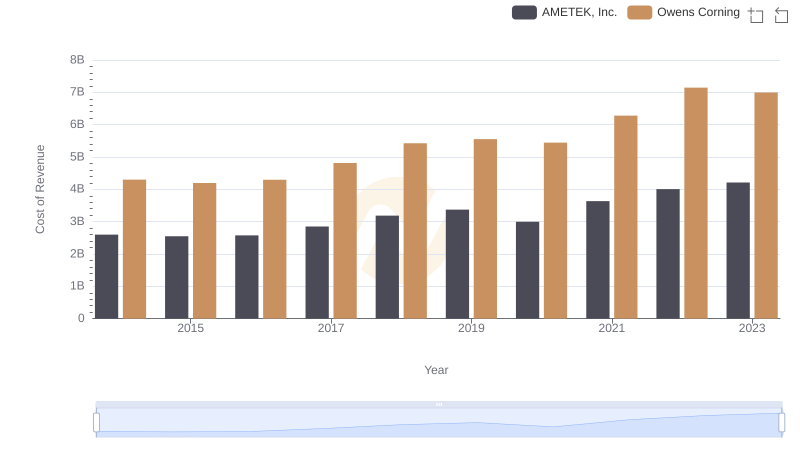
Cost of Revenue Trends: AMETEK, Inc. vs Owens Corning
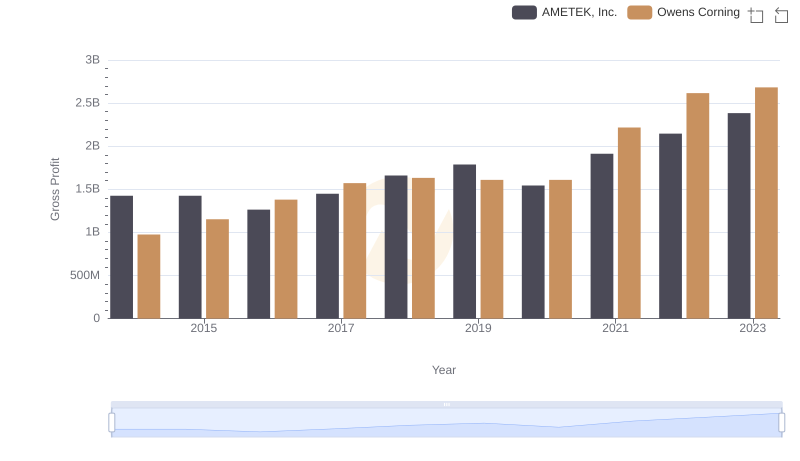
Who Generates Higher Gross Profit? AMETEK, Inc. or Owens Corning
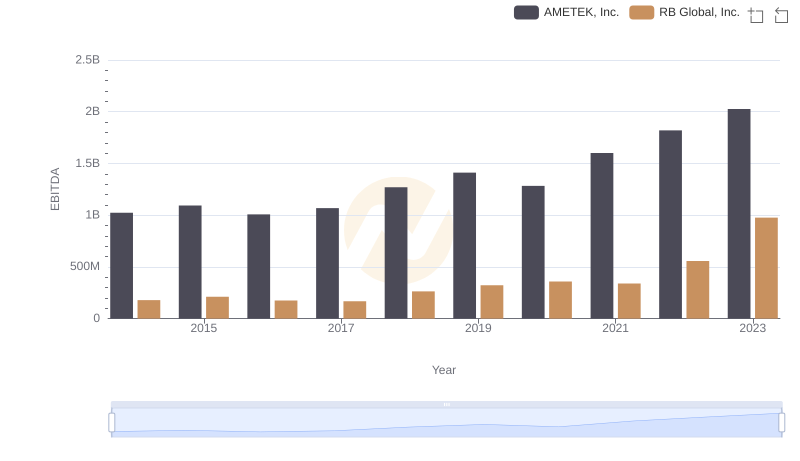
A Professional Review of EBITDA: AMETEK, Inc. Compared to RB Global, Inc.
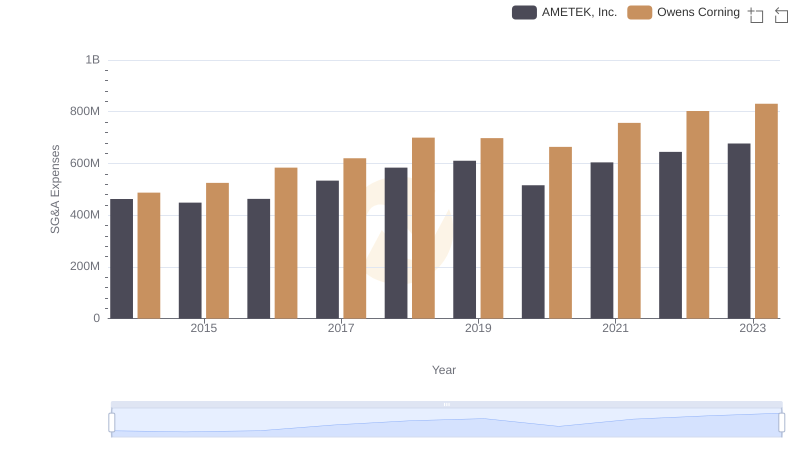
Comparing SG&A Expenses: AMETEK, Inc. vs Owens Corning Trends and Insights
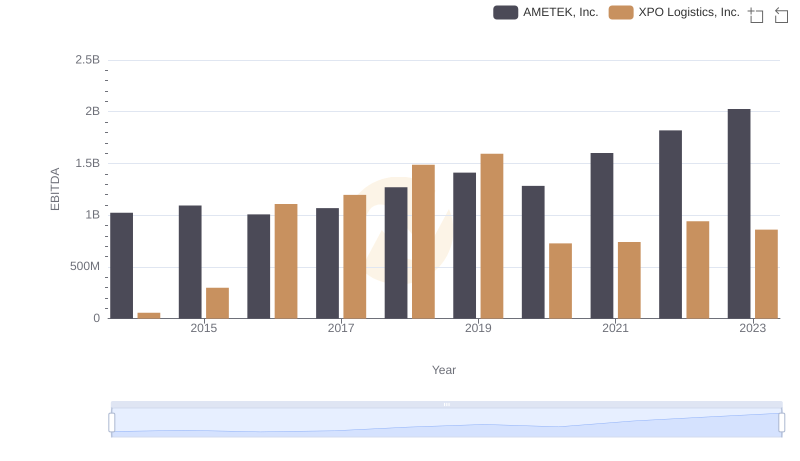
AMETEK, Inc. and XPO Logistics, Inc.: A Detailed Examination of EBITDA Performance
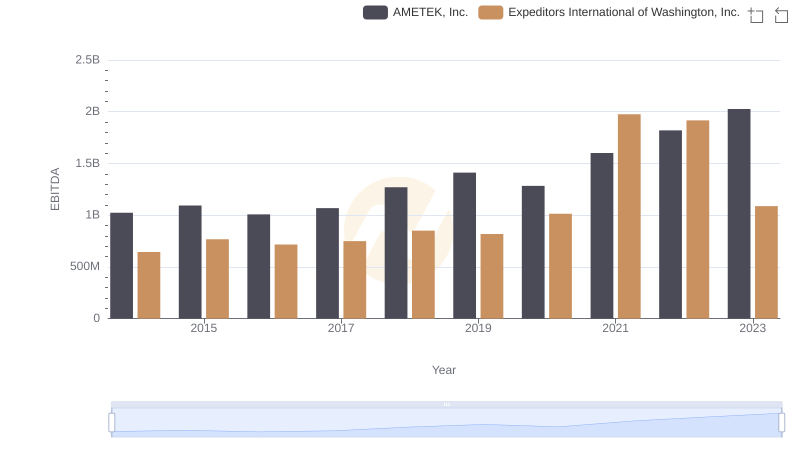
AMETEK, Inc. and Expeditors International of Washington, Inc.: A Detailed Examination of EBITDA Performance
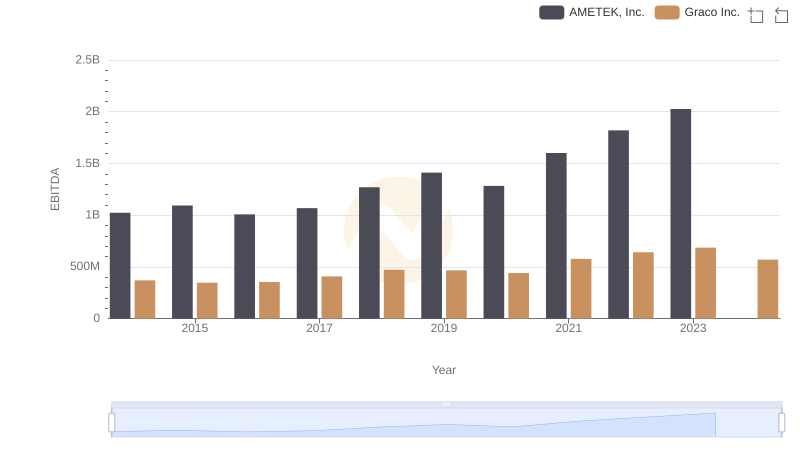
AMETEK, Inc. and Graco Inc.: A Detailed Examination of EBITDA Performance
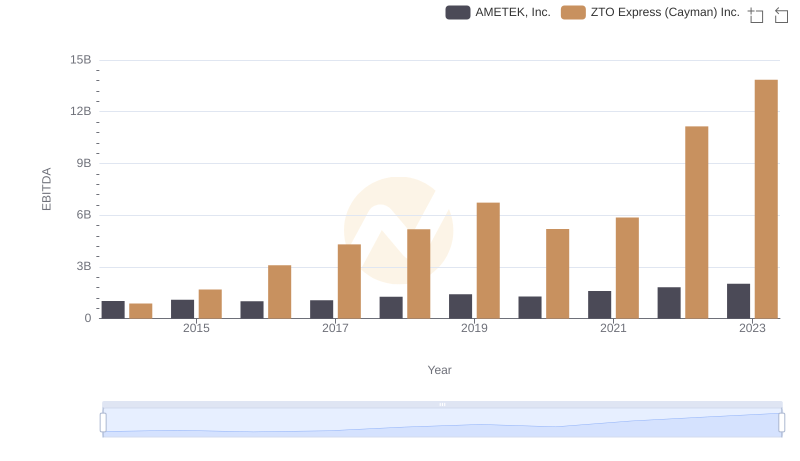
EBITDA Analysis: Evaluating AMETEK, Inc. Against ZTO Express (Cayman) Inc.