| __timestamp | AMETEK, Inc. | Comfort Systems USA, Inc. |
|---|---|---|
| Wednesday, January 1, 2014 | 1023344000 | 63455000 |
| Thursday, January 1, 2015 | 1093776000 | 112580000 |
| Friday, January 1, 2016 | 1007213000 | 126974000 |
| Sunday, January 1, 2017 | 1068174000 | 137151000 |
| Monday, January 1, 2018 | 1269415000 | 191982000 |
| Tuesday, January 1, 2019 | 1411422000 | 229518000 |
| Wednesday, January 1, 2020 | 1283159000 | 276904000 |
| Friday, January 1, 2021 | 1600782000 | 282506000 |
| Saturday, January 1, 2022 | 1820119000 | 352446000 |
| Sunday, January 1, 2023 | 2025843000 | 497652000 |
| Monday, January 1, 2024 | 1779562000 |
Data in motion
In the ever-evolving landscape of industrial and building systems, AMETEK, Inc. and Comfort Systems USA, Inc. have demonstrated remarkable financial resilience over the past decade. From 2014 to 2023, AMETEK's EBITDA surged by nearly 98%, reflecting its robust market strategies and operational efficiencies. In contrast, Comfort Systems USA, Inc. showcased an impressive growth of over 680% in the same period, highlighting its dynamic adaptation to the growing demand for HVAC services.
This side-by-side analysis offers a compelling narrative of two industry leaders navigating through economic shifts and technological advancements.
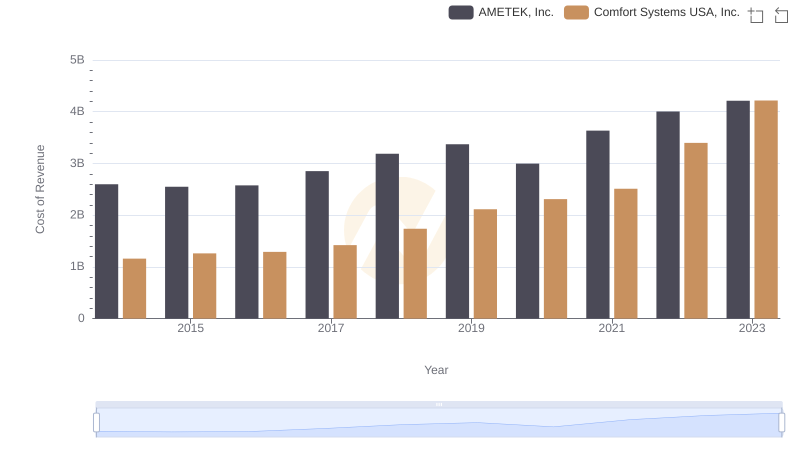
Cost of Revenue Comparison: AMETEK, Inc. vs Comfort Systems USA, Inc.
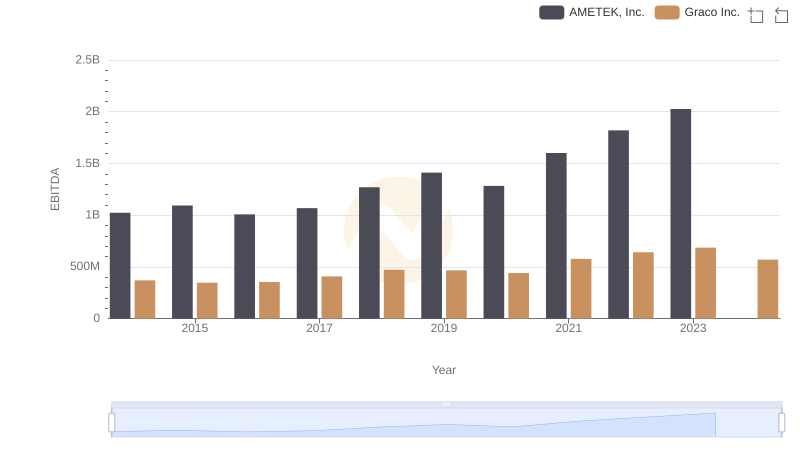
AMETEK, Inc. and Graco Inc.: A Detailed Examination of EBITDA Performance
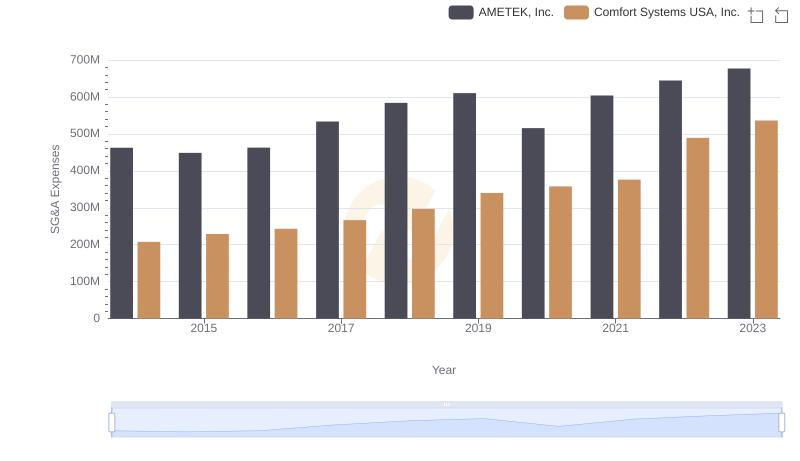
Who Optimizes SG&A Costs Better? AMETEK, Inc. or Comfort Systems USA, Inc.
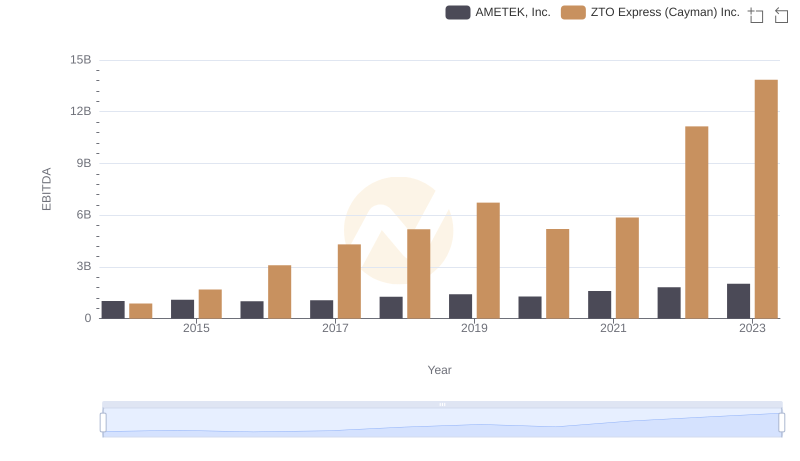
EBITDA Analysis: Evaluating AMETEK, Inc. Against ZTO Express (Cayman) Inc.
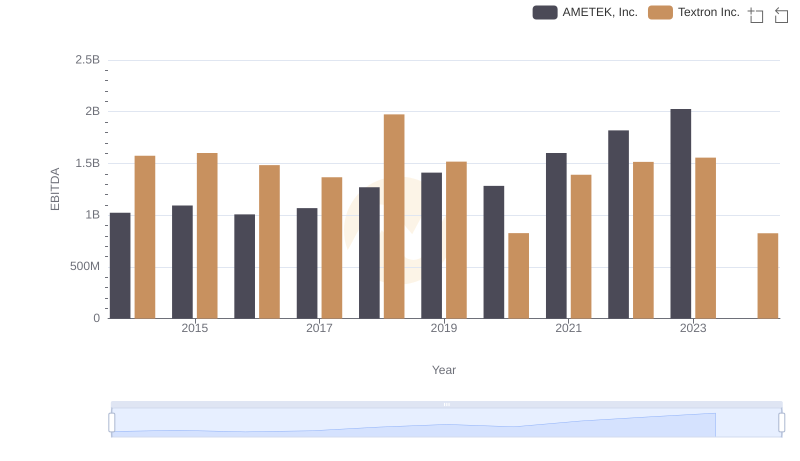
A Professional Review of EBITDA: AMETEK, Inc. Compared to Textron Inc.
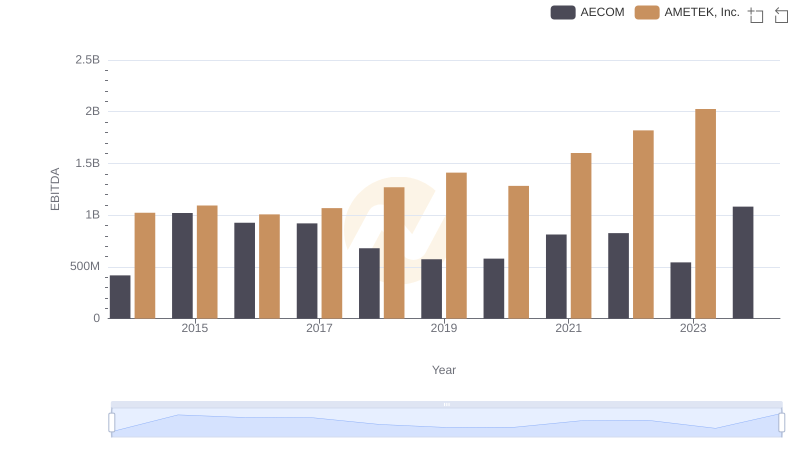
AMETEK, Inc. and AECOM: A Detailed Examination of EBITDA Performance
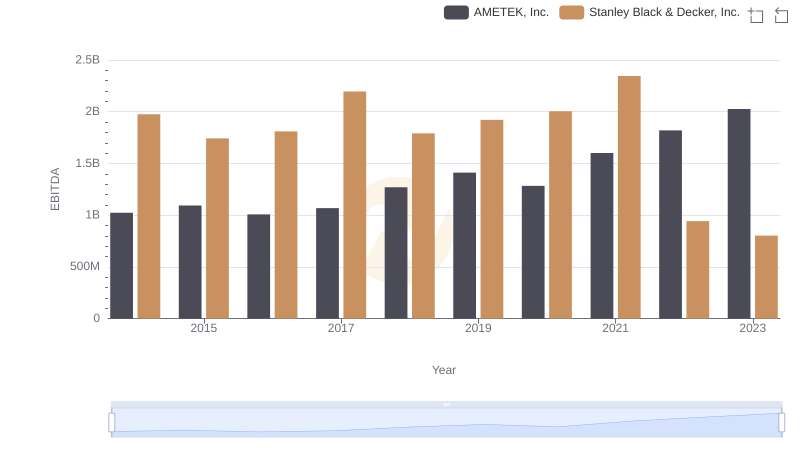
Professional EBITDA Benchmarking: AMETEK, Inc. vs Stanley Black & Decker, Inc.
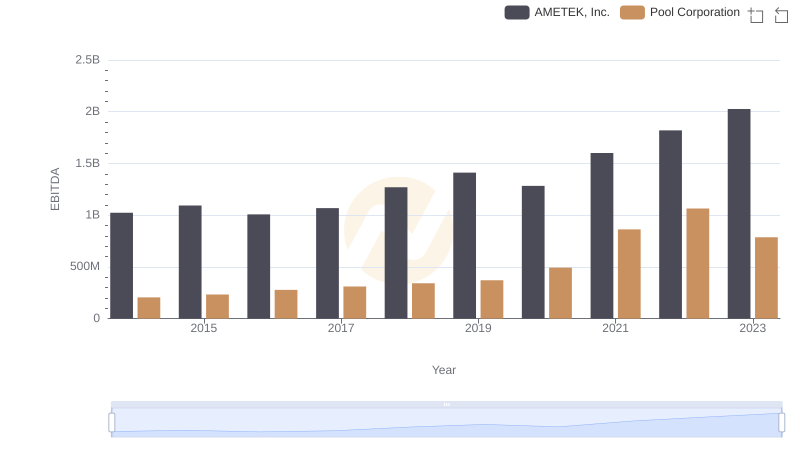
Professional EBITDA Benchmarking: AMETEK, Inc. vs Pool Corporation
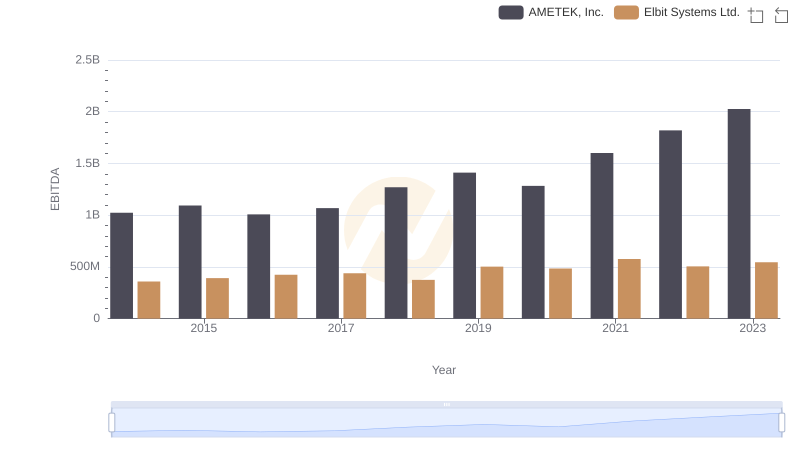
EBITDA Metrics Evaluated: AMETEK, Inc. vs Elbit Systems Ltd.