| __timestamp | AMETEK, Inc. | Textron Inc. |
|---|---|---|
| Wednesday, January 1, 2014 | 1023344000 | 1575000000 |
| Thursday, January 1, 2015 | 1093776000 | 1601000000 |
| Friday, January 1, 2016 | 1007213000 | 1484000000 |
| Sunday, January 1, 2017 | 1068174000 | 1367000000 |
| Monday, January 1, 2018 | 1269415000 | 1974000000 |
| Tuesday, January 1, 2019 | 1411422000 | 1518000000 |
| Wednesday, January 1, 2020 | 1283159000 | 827000000 |
| Friday, January 1, 2021 | 1600782000 | 1391000000 |
| Saturday, January 1, 2022 | 1820119000 | 1515000000 |
| Sunday, January 1, 2023 | 2025843000 | 1556000000 |
| Monday, January 1, 2024 | 1779562000 | 1422000000 |
Igniting the spark of knowledge
In the ever-evolving landscape of industrial manufacturing, AMETEK, Inc. and Textron Inc. have been pivotal players. Over the past decade, from 2014 to 2023, these giants have showcased intriguing trends in their EBITDA performance. AMETEK, Inc. has demonstrated a robust growth trajectory, with its EBITDA surging by approximately 98% from 2014 to 2023. This growth reflects AMETEK's strategic expansions and operational efficiencies. In contrast, Textron Inc. experienced a more volatile journey, with its EBITDA peaking in 2018 and then facing a significant dip in 2020, likely due to global economic challenges. However, Textron managed a recovery by 2023, albeit not reaching its 2018 heights. Notably, 2024 data for AMETEK is missing, leaving room for speculation on its future performance. This comparative analysis underscores the dynamic nature of the industrial sector and the resilience of these companies.
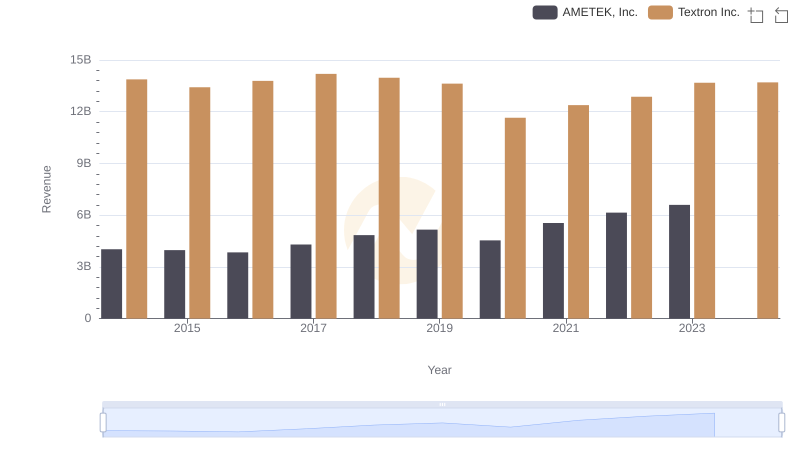
Breaking Down Revenue Trends: AMETEK, Inc. vs Textron Inc.
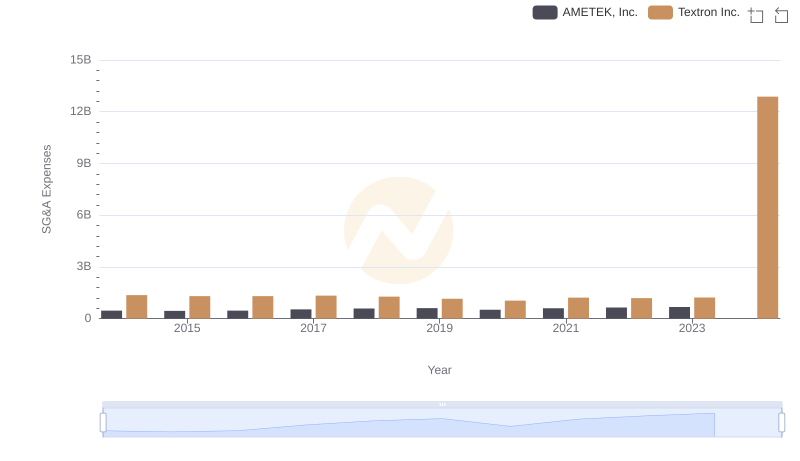
SG&A Efficiency Analysis: Comparing AMETEK, Inc. and Textron Inc.
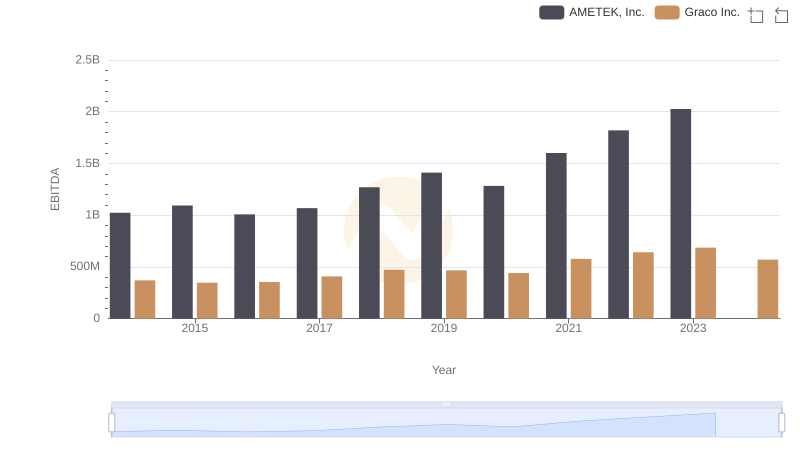
AMETEK, Inc. and Graco Inc.: A Detailed Examination of EBITDA Performance
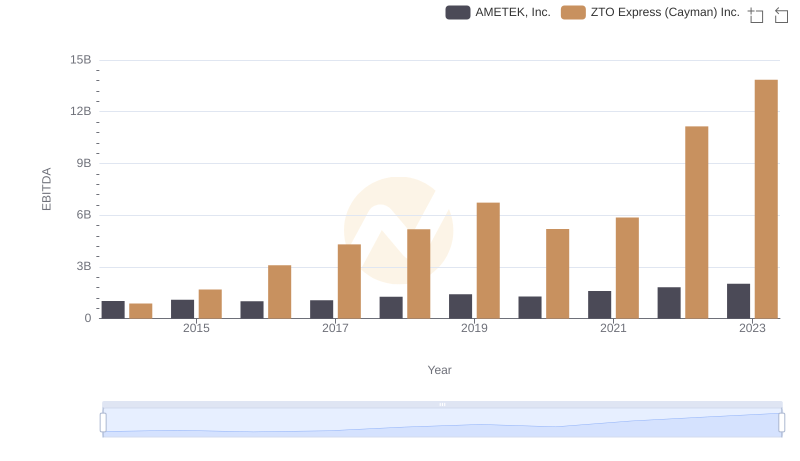
EBITDA Analysis: Evaluating AMETEK, Inc. Against ZTO Express (Cayman) Inc.
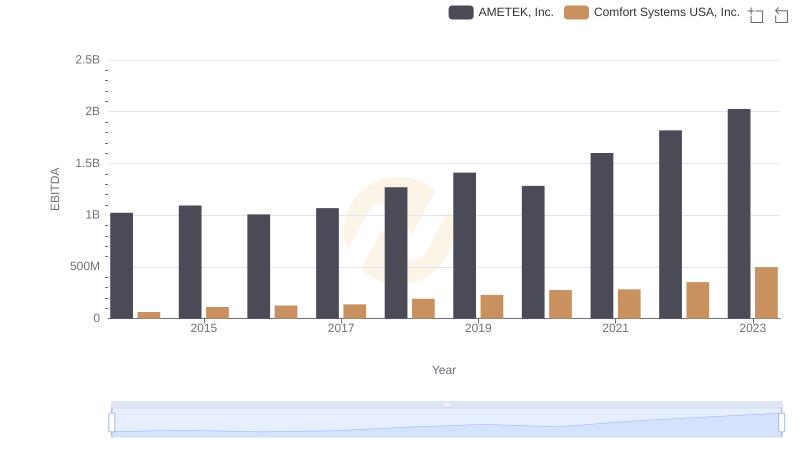
A Side-by-Side Analysis of EBITDA: AMETEK, Inc. and Comfort Systems USA, Inc.
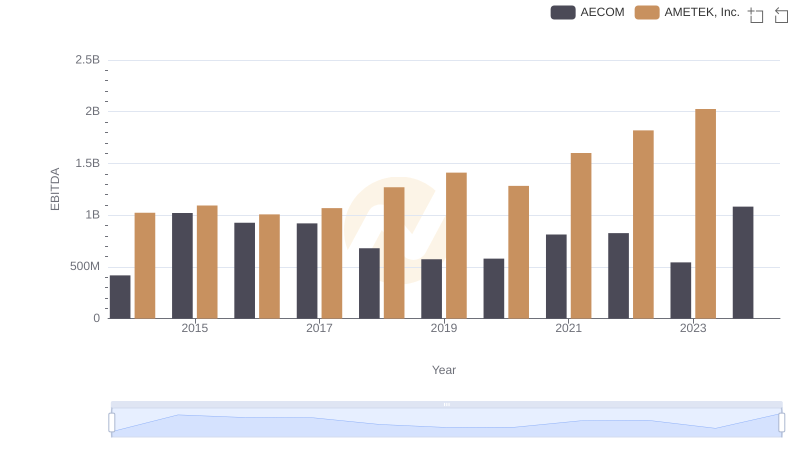
AMETEK, Inc. and AECOM: A Detailed Examination of EBITDA Performance
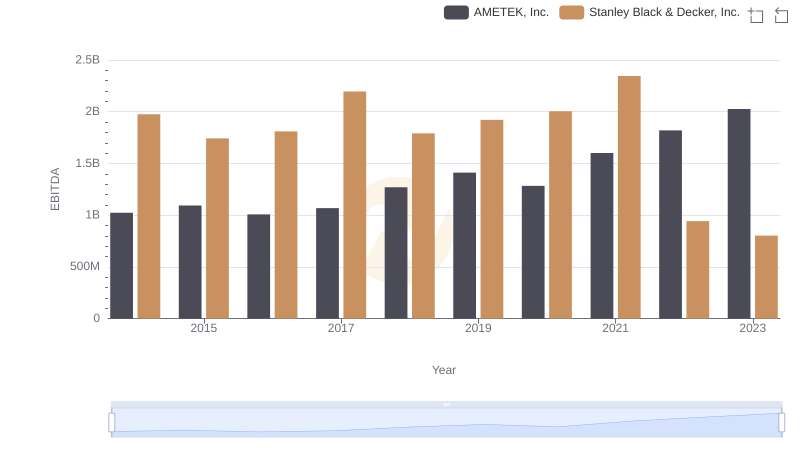
Professional EBITDA Benchmarking: AMETEK, Inc. vs Stanley Black & Decker, Inc.
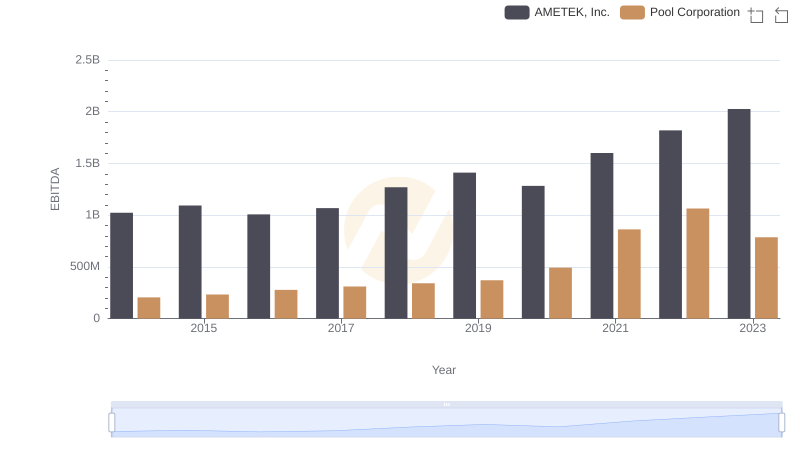
Professional EBITDA Benchmarking: AMETEK, Inc. vs Pool Corporation