| __timestamp | AMETEK, Inc. | ZTO Express (Cayman) Inc. |
|---|---|---|
| Wednesday, January 1, 2014 | 1424947000 | 1133042000 |
| Thursday, January 1, 2015 | 1425015000 | 2087718000 |
| Friday, January 1, 2016 | 1264867000 | 3442869000 |
| Sunday, January 1, 2017 | 1448739000 | 4345584000 |
| Monday, January 1, 2018 | 1659562000 | 5364883000 |
| Tuesday, January 1, 2019 | 1787660000 | 6621168000 |
| Wednesday, January 1, 2020 | 1543514000 | 5837106000 |
| Friday, January 1, 2021 | 1912614000 | 6589377000 |
| Saturday, January 1, 2022 | 2145269000 | 9039275000 |
| Sunday, January 1, 2023 | 2384465001 | 11662526000 |
| Monday, January 1, 2024 | 6941180000 |
Igniting the spark of knowledge
In the ever-evolving landscape of global commerce, AMETEK, Inc. and ZTO Express (Cayman) Inc. have emerged as formidable players. Over the past decade, these companies have showcased remarkable growth in their gross profits, reflecting their strategic prowess and market adaptability.
From 2014 to 2023, AMETEK, Inc. saw a steady increase in gross profit, culminating in a 67% rise by 2023. Meanwhile, ZTO Express (Cayman) Inc. experienced an explosive growth of over 900% during the same period, underscoring its rapid expansion in the logistics sector.
This comparison highlights the diverse strategies employed by these companies. While AMETEK, Inc. has maintained consistent growth, ZTO Express has capitalized on the booming e-commerce market in China. As we look to the future, these trends offer valuable insights into the dynamics of global business.
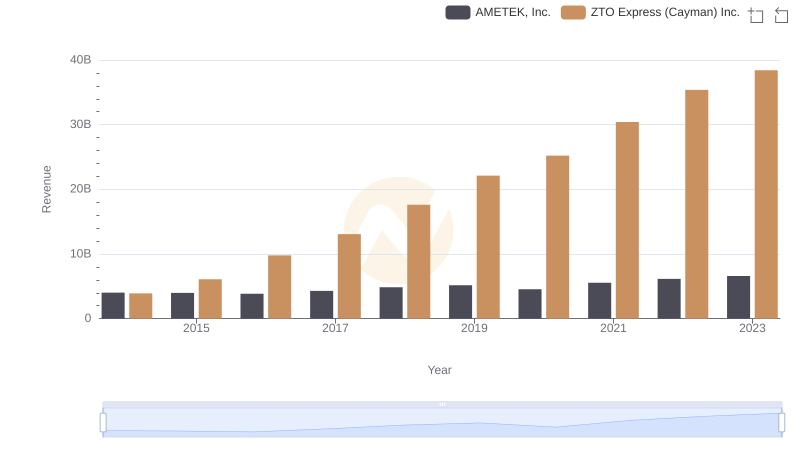
AMETEK, Inc. and ZTO Express (Cayman) Inc.: A Comprehensive Revenue Analysis
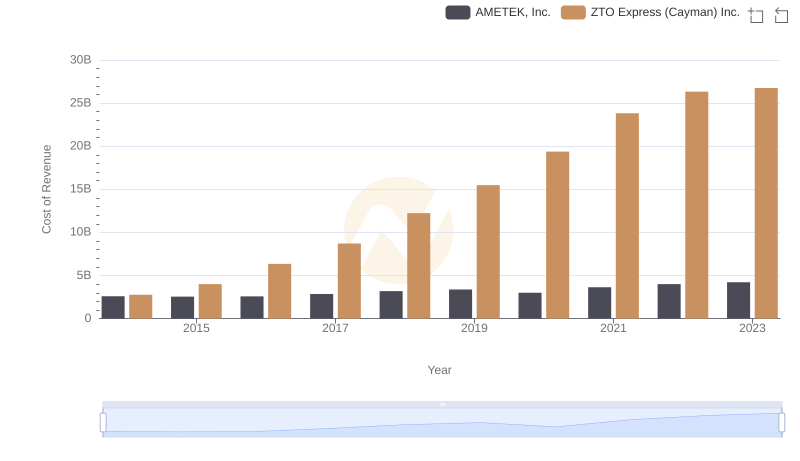
Cost Insights: Breaking Down AMETEK, Inc. and ZTO Express (Cayman) Inc.'s Expenses
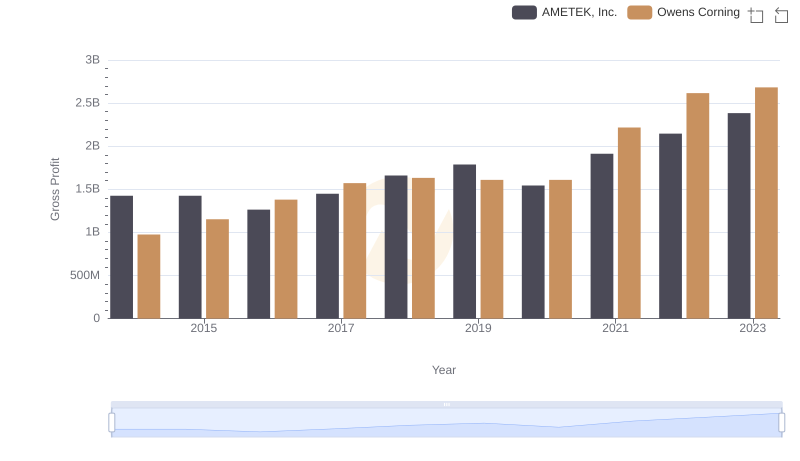
Who Generates Higher Gross Profit? AMETEK, Inc. or Owens Corning
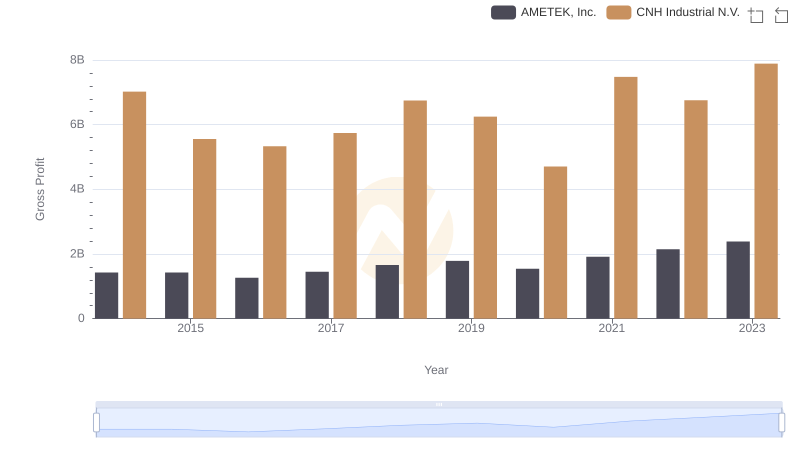
Gross Profit Trends Compared: AMETEK, Inc. vs CNH Industrial N.V.
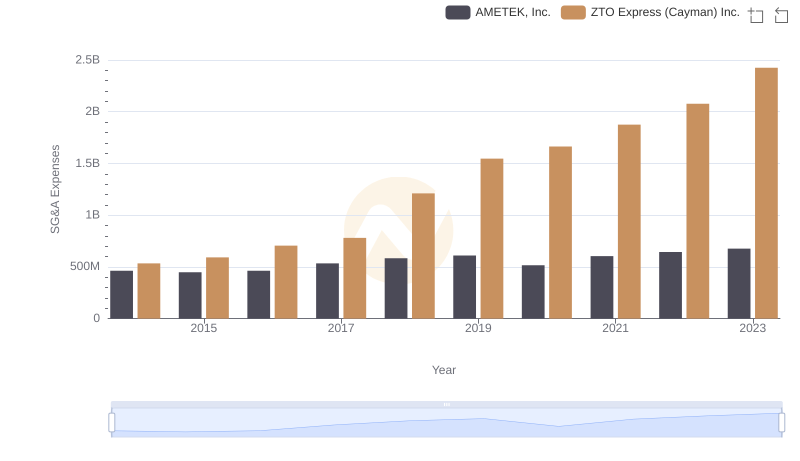
AMETEK, Inc. or ZTO Express (Cayman) Inc.: Who Manages SG&A Costs Better?
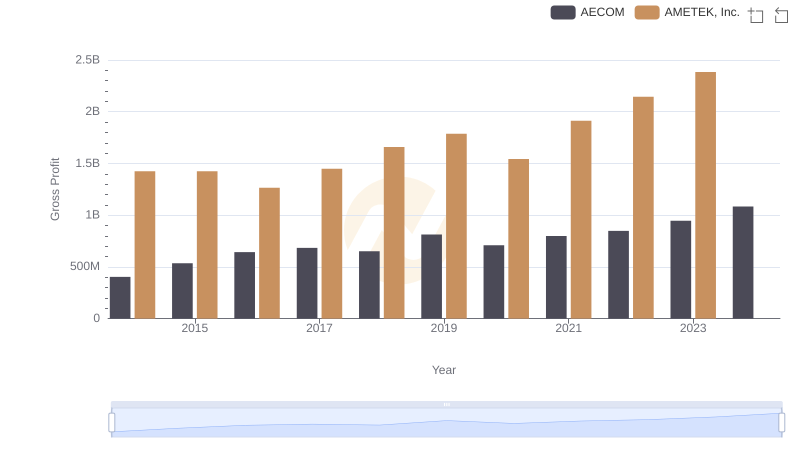
Gross Profit Trends Compared: AMETEK, Inc. vs AECOM
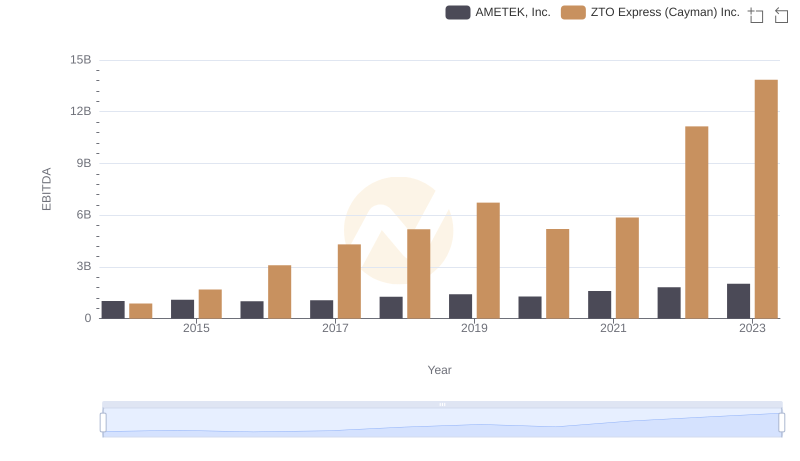
EBITDA Analysis: Evaluating AMETEK, Inc. Against ZTO Express (Cayman) Inc.