| __timestamp | AMETEK, Inc. | Expeditors International of Washington, Inc. |
|---|---|---|
| Wednesday, January 1, 2014 | 1023344000 | 643940000 |
| Thursday, January 1, 2015 | 1093776000 | 767496000 |
| Friday, January 1, 2016 | 1007213000 | 716959000 |
| Sunday, January 1, 2017 | 1068174000 | 749570000 |
| Monday, January 1, 2018 | 1269415000 | 850582000 |
| Tuesday, January 1, 2019 | 1411422000 | 817642000 |
| Wednesday, January 1, 2020 | 1283159000 | 1013523000 |
| Friday, January 1, 2021 | 1600782000 | 1975928000 |
| Saturday, January 1, 2022 | 1820119000 | 1916506000 |
| Sunday, January 1, 2023 | 2025843000 | 1087588000 |
| Monday, January 1, 2024 | 1779562000 | 1154330000 |
Unleashing insights
In the ever-evolving landscape of corporate finance, EBITDA serves as a crucial indicator of a company's operational performance. Over the past decade, AMETEK, Inc. and Expeditors International of Washington, Inc. have showcased intriguing trends in their EBITDA figures. From 2014 to 2023, AMETEK's EBITDA surged by nearly 98%, reflecting a robust growth trajectory. In contrast, Expeditors International experienced a more modest increase of approximately 69% during the same period.
These trends underscore the dynamic nature of these industries and the strategic maneuvers by these companies to maintain competitive edges.
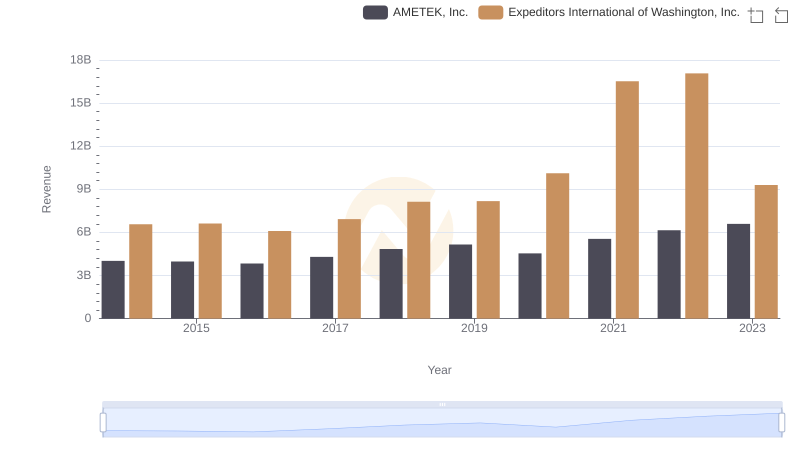
AMETEK, Inc. and Expeditors International of Washington, Inc.: A Comprehensive Revenue Analysis
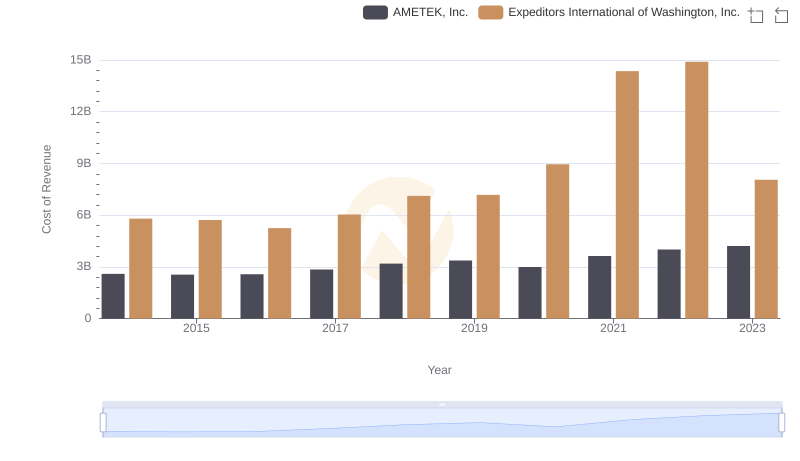
Cost of Revenue Comparison: AMETEK, Inc. vs Expeditors International of Washington, Inc.
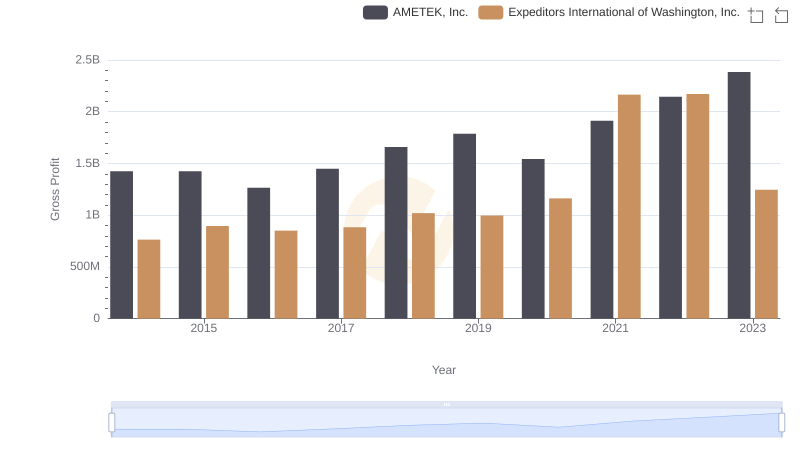
AMETEK, Inc. vs Expeditors International of Washington, Inc.: A Gross Profit Performance Breakdown
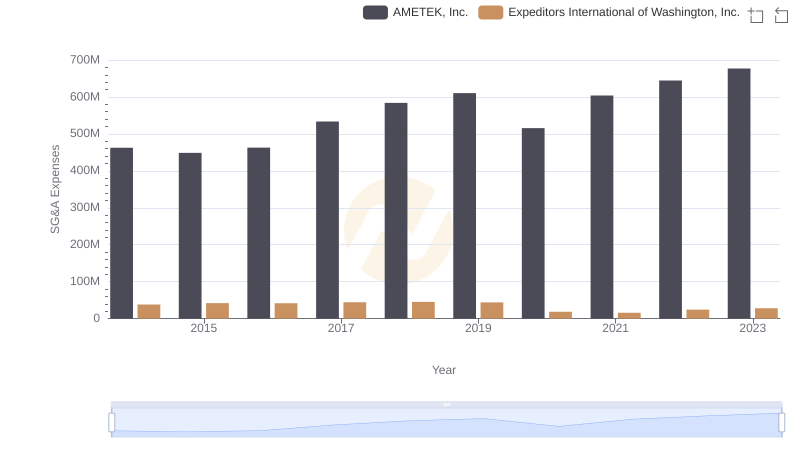
Operational Costs Compared: SG&A Analysis of AMETEK, Inc. and Expeditors International of Washington, Inc.
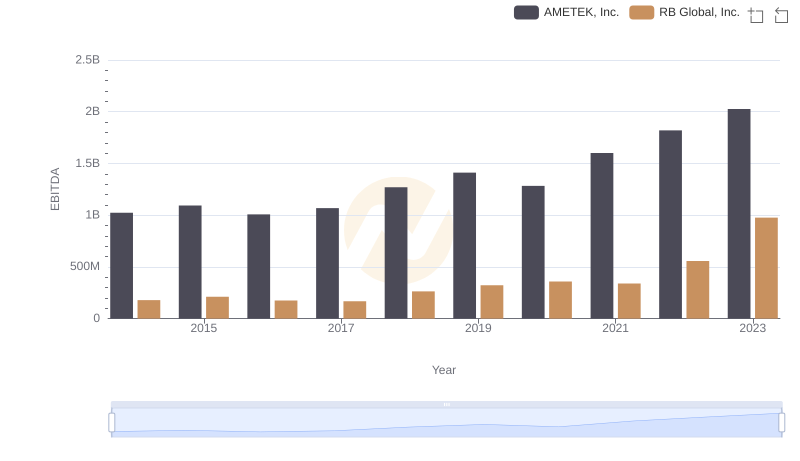
A Professional Review of EBITDA: AMETEK, Inc. Compared to RB Global, Inc.
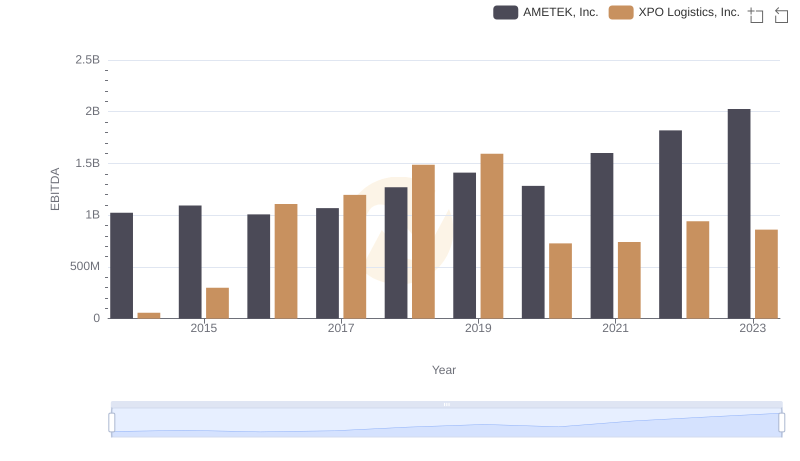
AMETEK, Inc. and XPO Logistics, Inc.: A Detailed Examination of EBITDA Performance
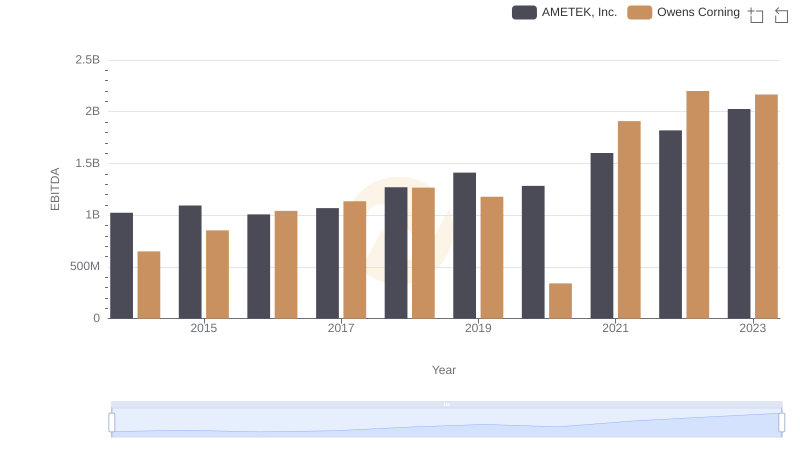
EBITDA Performance Review: AMETEK, Inc. vs Owens Corning
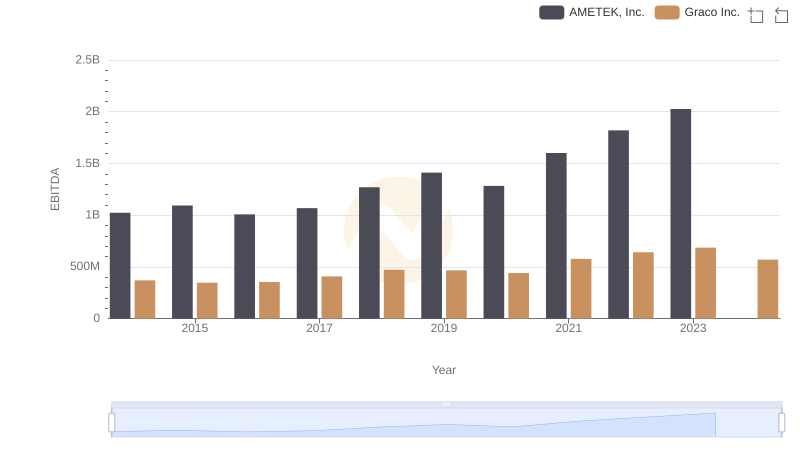
AMETEK, Inc. and Graco Inc.: A Detailed Examination of EBITDA Performance
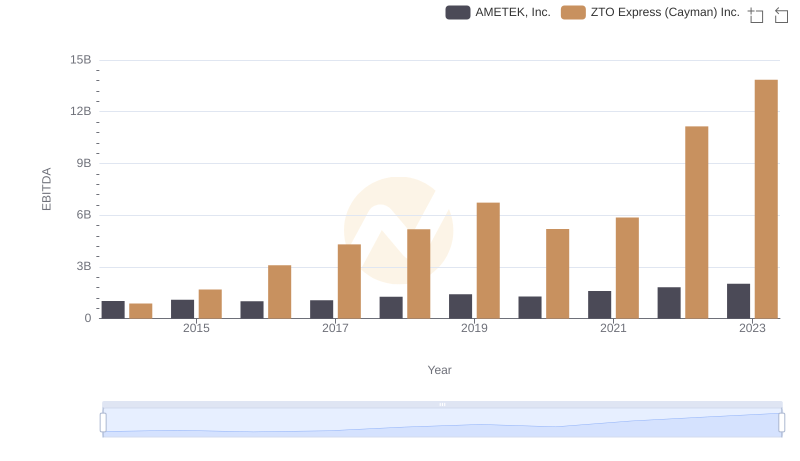
EBITDA Analysis: Evaluating AMETEK, Inc. Against ZTO Express (Cayman) Inc.