| __timestamp | AMETEK, Inc. | ZTO Express (Cayman) Inc. |
|---|---|---|
| Wednesday, January 1, 2014 | 2597017000 | 2770530000 |
| Thursday, January 1, 2015 | 2549280000 | 3998737000 |
| Friday, January 1, 2016 | 2575220000 | 6345899000 |
| Sunday, January 1, 2017 | 2851431000 | 8714489000 |
| Monday, January 1, 2018 | 3186310000 | 12239568000 |
| Tuesday, January 1, 2019 | 3370897000 | 15488778000 |
| Wednesday, January 1, 2020 | 2996515000 | 19377184000 |
| Friday, January 1, 2021 | 3633900000 | 23816462000 |
| Saturday, January 1, 2022 | 4005261000 | 26337721000 |
| Sunday, January 1, 2023 | 4212484999 | 26756389000 |
| Monday, January 1, 2024 | 0 |
Data in motion
In the ever-evolving landscape of global business, understanding cost structures is pivotal. This analysis delves into the cost of revenue trends for AMETEK, Inc. and ZTO Express (Cayman) Inc. from 2014 to 2023. Over this period, AMETEK, Inc. experienced a steady increase in its cost of revenue, growing by approximately 62% from 2014 to 2023. In contrast, ZTO Express (Cayman) Inc. saw a staggering 866% rise, reflecting its rapid expansion in the logistics sector.
These insights highlight the contrasting growth trajectories and strategic priorities of these two industry giants.
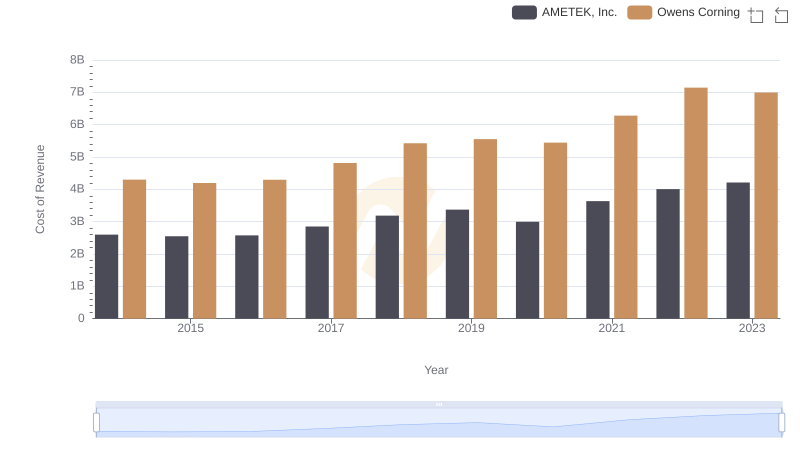
Cost of Revenue Trends: AMETEK, Inc. vs Owens Corning
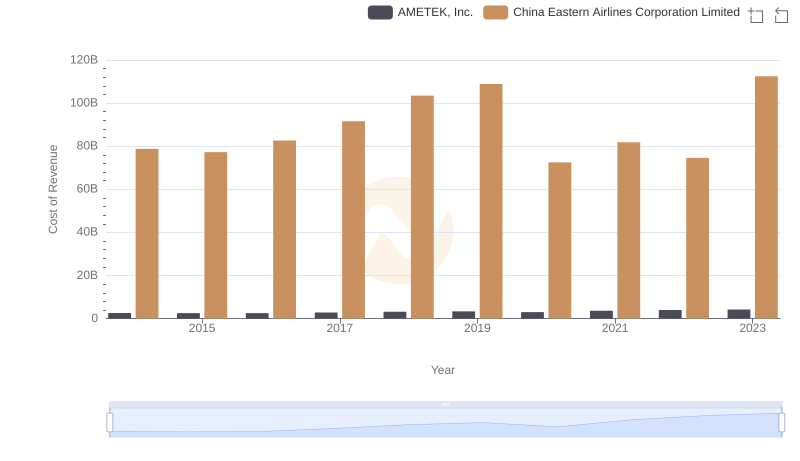
Comparing Cost of Revenue Efficiency: AMETEK, Inc. vs China Eastern Airlines Corporation Limited
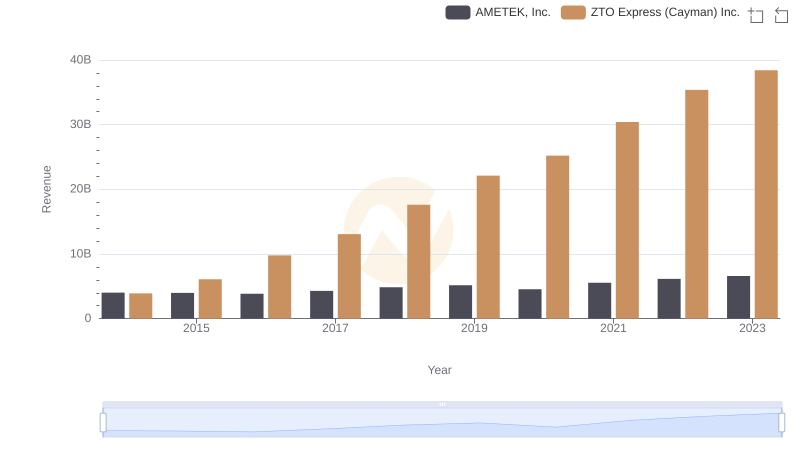
AMETEK, Inc. and ZTO Express (Cayman) Inc.: A Comprehensive Revenue Analysis
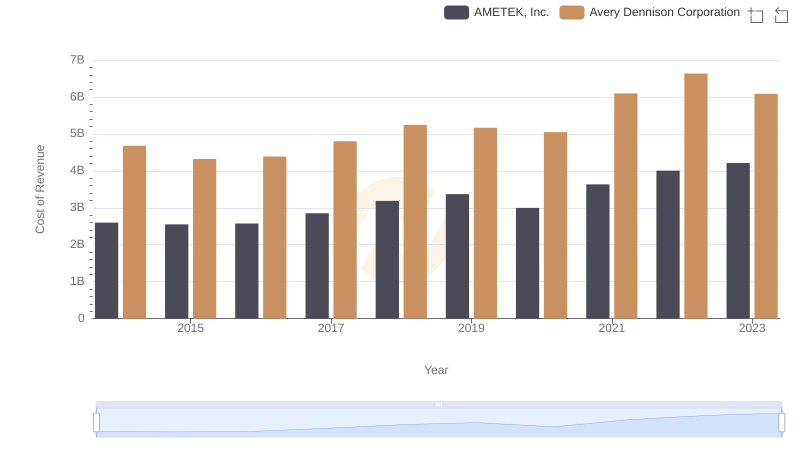
AMETEK, Inc. vs Avery Dennison Corporation: Efficiency in Cost of Revenue Explored
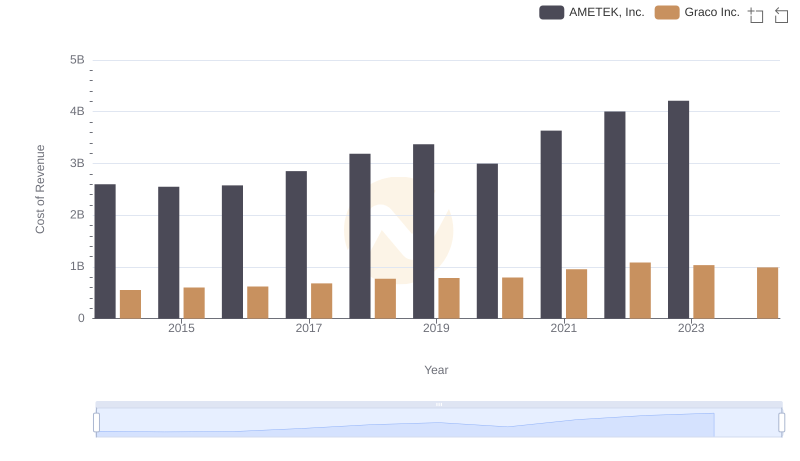
Cost of Revenue Trends: AMETEK, Inc. vs Graco Inc.
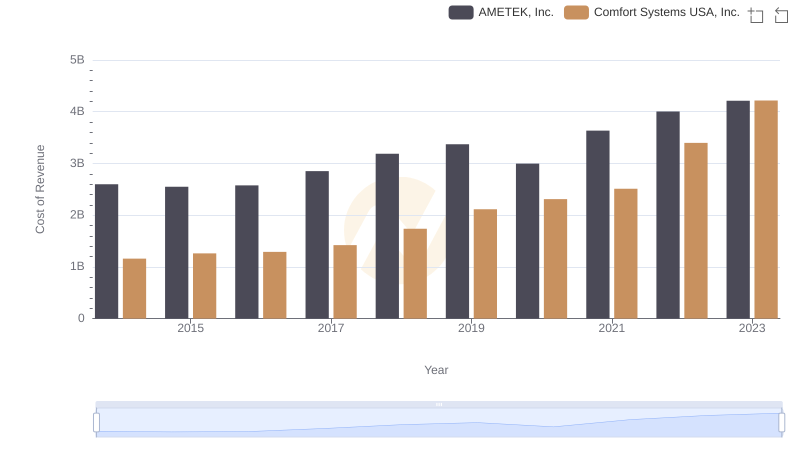
Cost of Revenue Comparison: AMETEK, Inc. vs Comfort Systems USA, Inc.
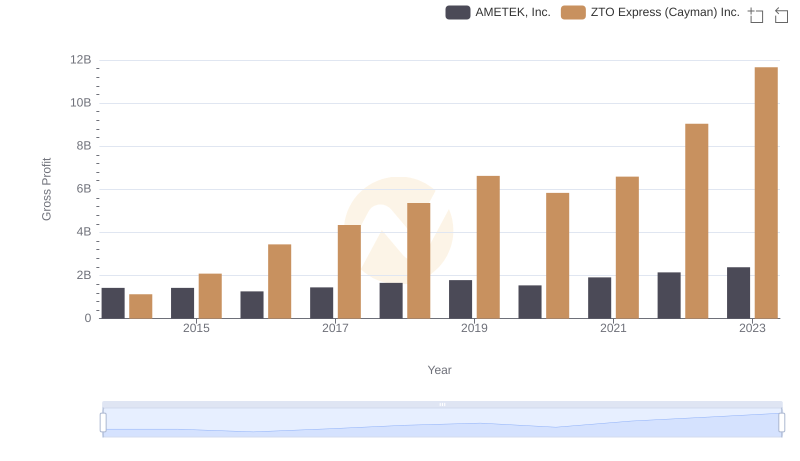
Gross Profit Comparison: AMETEK, Inc. and ZTO Express (Cayman) Inc. Trends
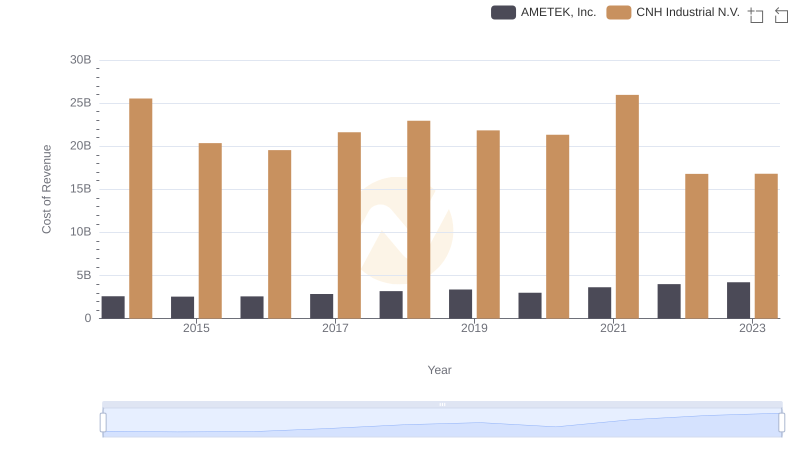
Cost Insights: Breaking Down AMETEK, Inc. and CNH Industrial N.V.'s Expenses
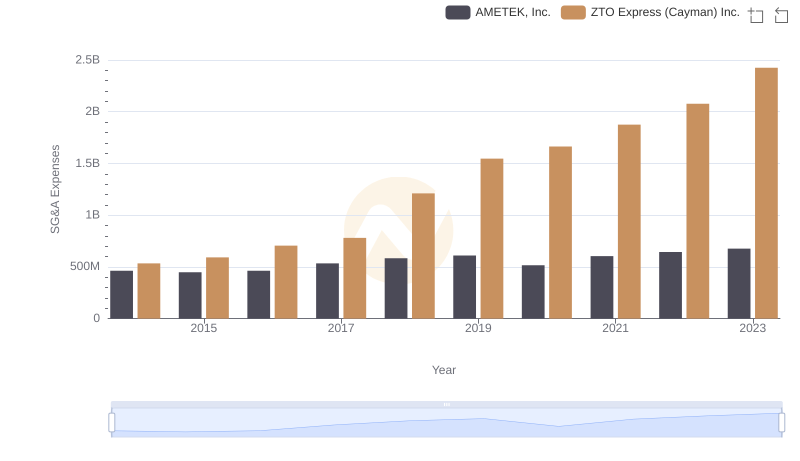
AMETEK, Inc. or ZTO Express (Cayman) Inc.: Who Manages SG&A Costs Better?
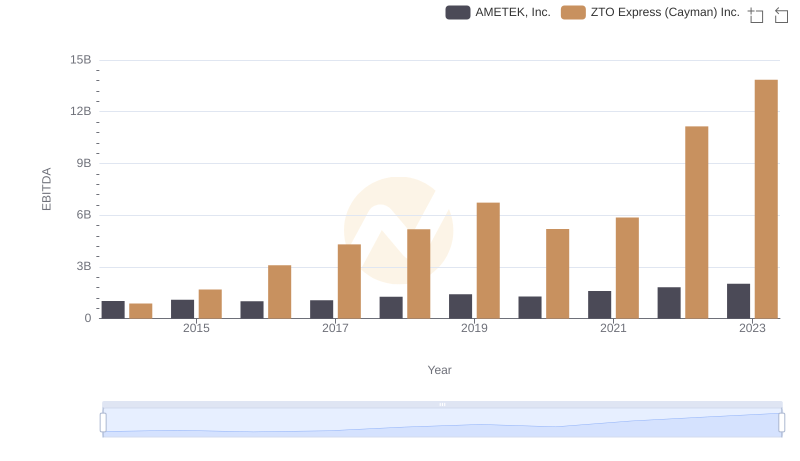
EBITDA Analysis: Evaluating AMETEK, Inc. Against ZTO Express (Cayman) Inc.