| __timestamp | AMETEK, Inc. | Graco Inc. |
|---|---|---|
| Wednesday, January 1, 2014 | 1023344000 | 369321000 |
| Thursday, January 1, 2015 | 1093776000 | 346732000 |
| Friday, January 1, 2016 | 1007213000 | 354454000 |
| Sunday, January 1, 2017 | 1068174000 | 408879000 |
| Monday, January 1, 2018 | 1269415000 | 472905000 |
| Tuesday, January 1, 2019 | 1411422000 | 466687000 |
| Wednesday, January 1, 2020 | 1283159000 | 440431000 |
| Friday, January 1, 2021 | 1600782000 | 578005000 |
| Saturday, January 1, 2022 | 1820119000 | 641618000 |
| Sunday, January 1, 2023 | 2025843000 | 686593000 |
| Monday, January 1, 2024 | 1779562000 | 570098000 |
In pursuit of knowledge
In the ever-evolving landscape of industrial manufacturing, AMETEK, Inc. and Graco Inc. have emerged as key players, showcasing impressive EBITDA growth over the past decade. From 2014 to 2023, AMETEK, Inc. has seen its EBITDA soar by nearly 98%, reflecting its strategic expansions and operational efficiencies. In contrast, Graco Inc. has achieved a commendable 86% increase in the same period, underscoring its resilience and adaptability in a competitive market.
While 2024 data for AMETEK is missing, Graco's slight dip suggests potential market challenges ahead. This analysis provides a snapshot of industrial giants navigating growth and challenges in a dynamic economic environment.
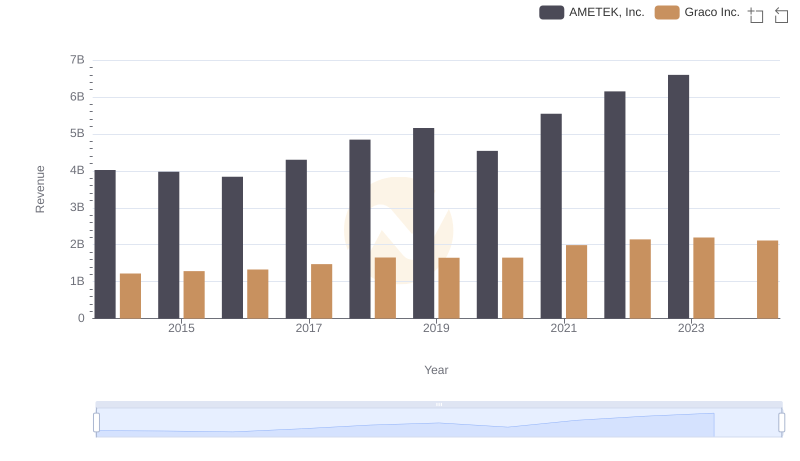
Annual Revenue Comparison: AMETEK, Inc. vs Graco Inc.
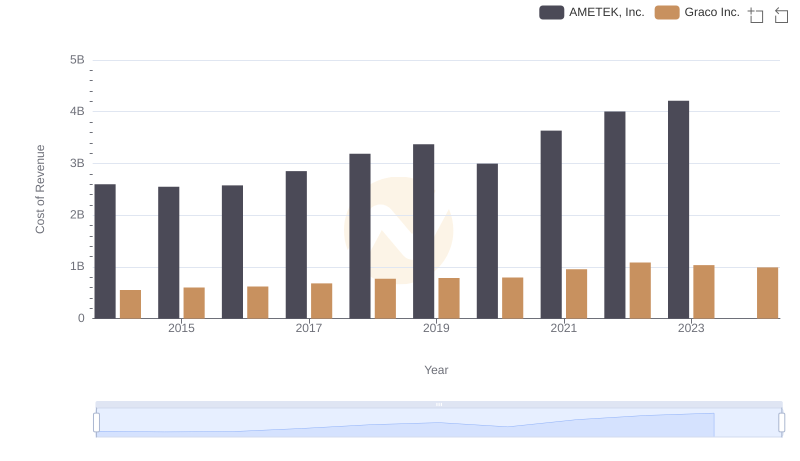
Cost of Revenue Trends: AMETEK, Inc. vs Graco Inc.
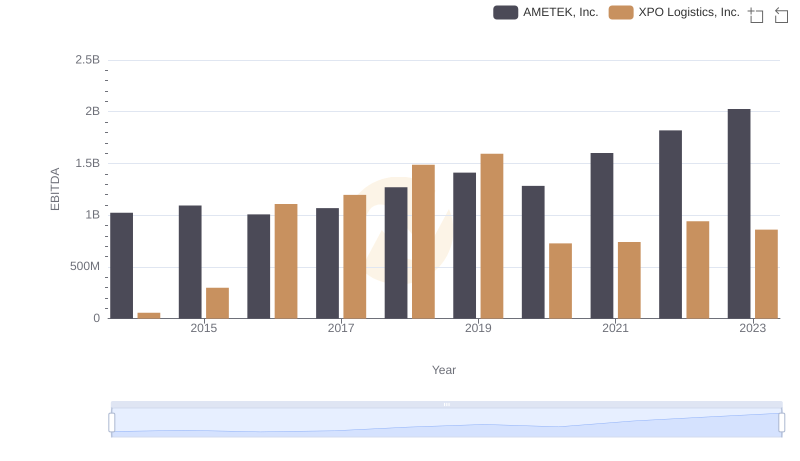
AMETEK, Inc. and XPO Logistics, Inc.: A Detailed Examination of EBITDA Performance
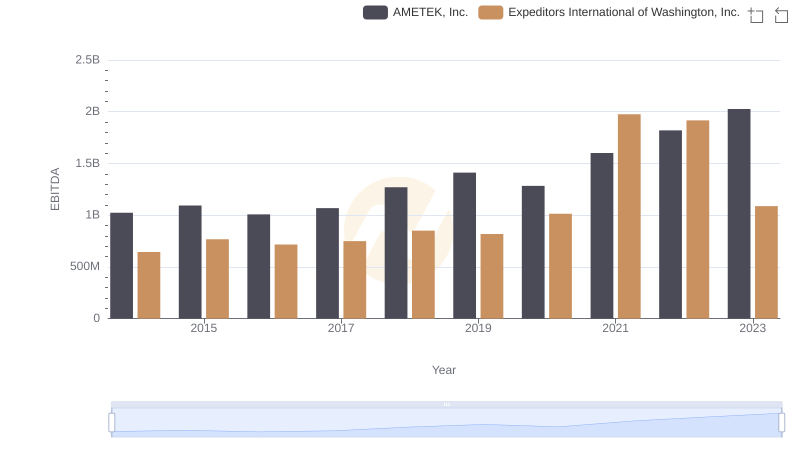
AMETEK, Inc. and Expeditors International of Washington, Inc.: A Detailed Examination of EBITDA Performance
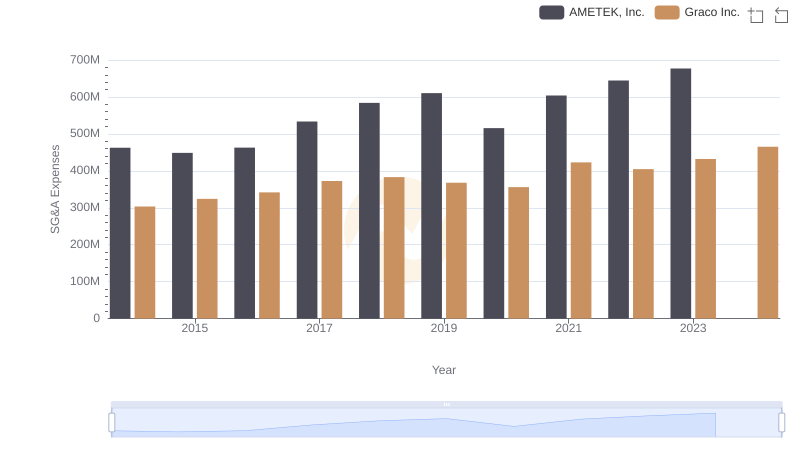
AMETEK, Inc. or Graco Inc.: Who Manages SG&A Costs Better?
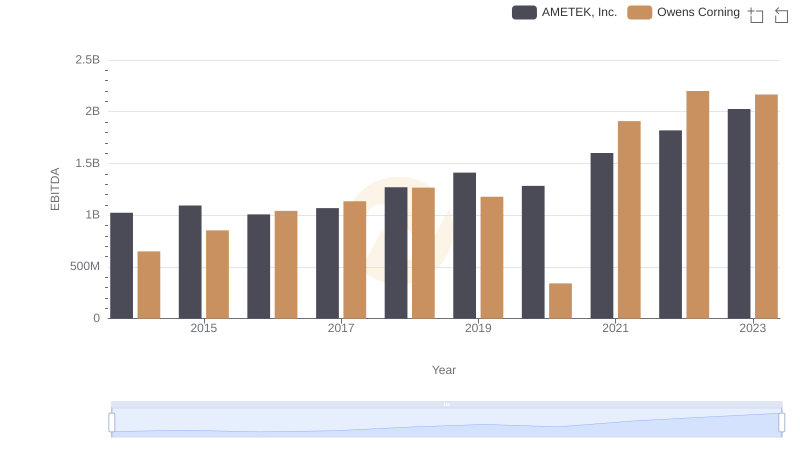
EBITDA Performance Review: AMETEK, Inc. vs Owens Corning
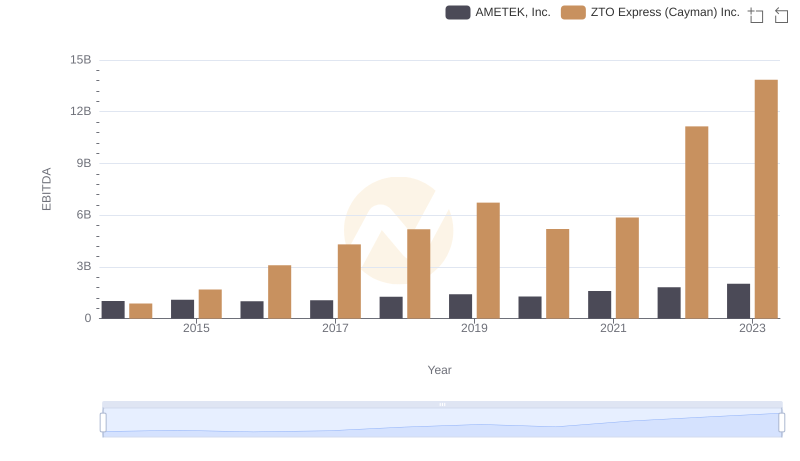
EBITDA Analysis: Evaluating AMETEK, Inc. Against ZTO Express (Cayman) Inc.
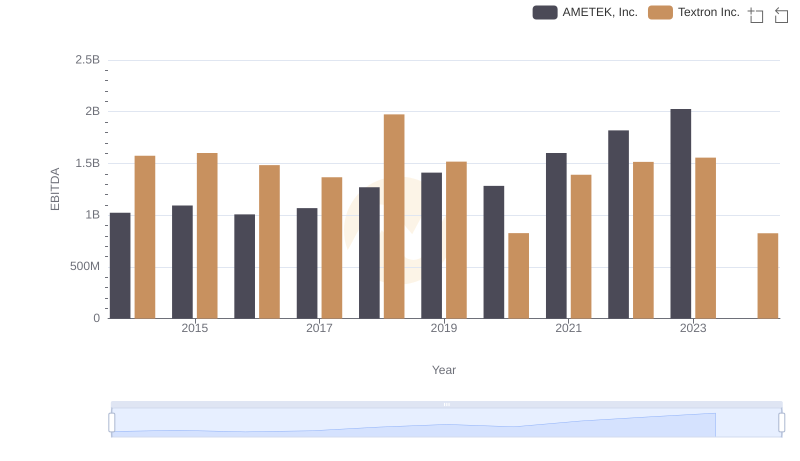
A Professional Review of EBITDA: AMETEK, Inc. Compared to Textron Inc.
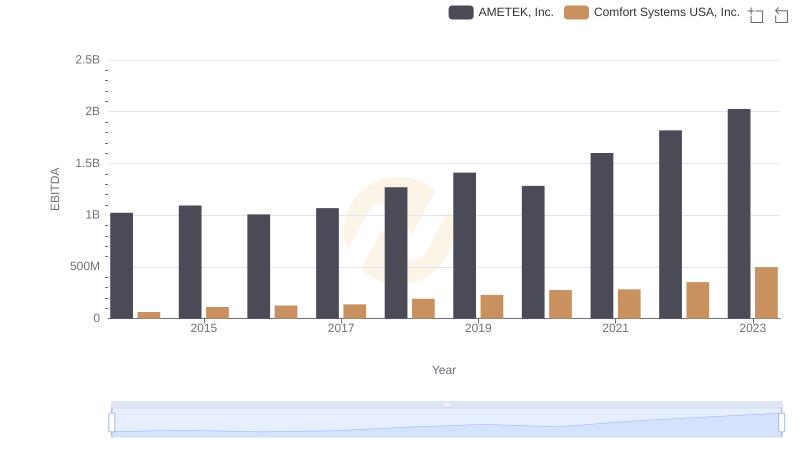
A Side-by-Side Analysis of EBITDA: AMETEK, Inc. and Comfort Systems USA, Inc.