| __timestamp | CNH Industrial N.V. | CSX Corporation |
|---|---|---|
| Wednesday, January 1, 2014 | 2591000000 | 4740000000 |
| Thursday, January 1, 2015 | 1757000000 | 4890000000 |
| Friday, January 1, 2016 | 1063000000 | 4640000000 |
| Sunday, January 1, 2017 | 1715000000 | 5113000000 |
| Monday, January 1, 2018 | 2339000000 | 6274000000 |
| Tuesday, January 1, 2019 | 2077000000 | 6402000000 |
| Wednesday, January 1, 2020 | 807000000 | 5764000000 |
| Friday, January 1, 2021 | 2650000000 | 6653000000 |
| Saturday, January 1, 2022 | 3447000000 | 7390000000 |
| Sunday, January 1, 2023 | 5549000000 | 7340000000 |
Unleashing the power of data
In the ever-evolving landscape of global transportation and industrial sectors, understanding financial performance is crucial. This analysis delves into the EBITDA trends of CSX Corporation and CNH Industrial N.V. from 2014 to 2023. Over this period, CSX Corporation consistently outperformed CNH Industrial, with an average EBITDA nearly 2.5 times higher. Notably, CSX's EBITDA peaked in 2022, marking a 58% increase from 2014, reflecting robust operational efficiency and strategic growth initiatives. Meanwhile, CNH Industrial showed a remarkable recovery post-2020, with a 588% surge in EBITDA by 2023, highlighting its resilience and adaptability in challenging market conditions. This financial journey underscores the dynamic nature of these industries and the strategic maneuvers companies must employ to thrive.
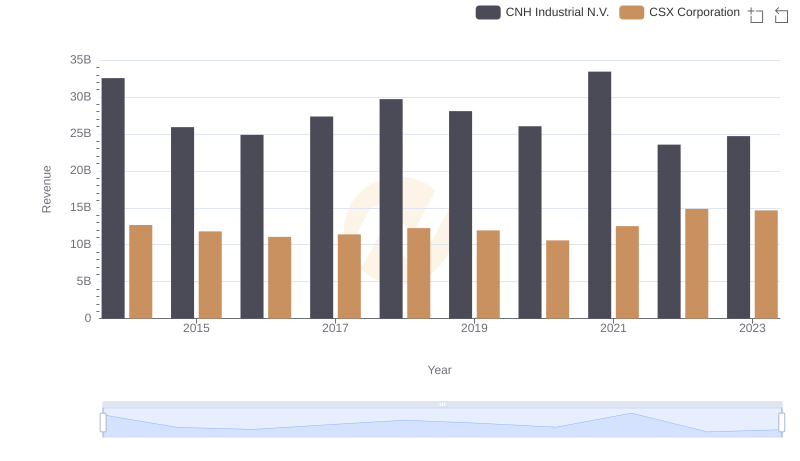
CSX Corporation vs CNH Industrial N.V.: Annual Revenue Growth Compared
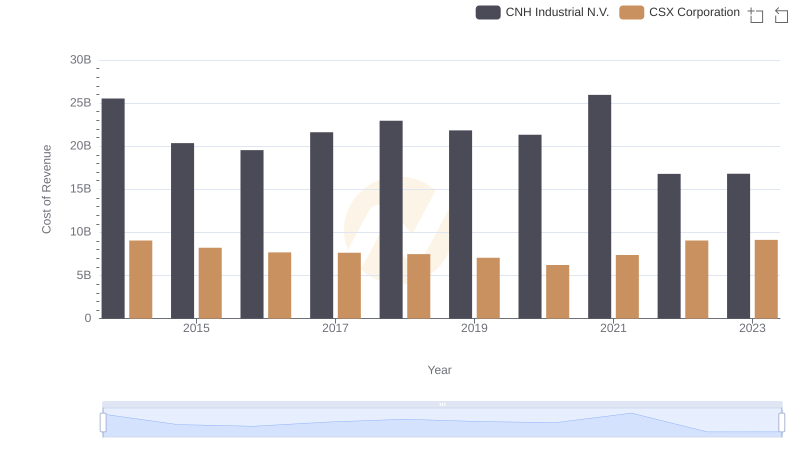
Cost Insights: Breaking Down CSX Corporation and CNH Industrial N.V.'s Expenses

A Professional Review of EBITDA: CSX Corporation Compared to Comfort Systems USA, Inc.
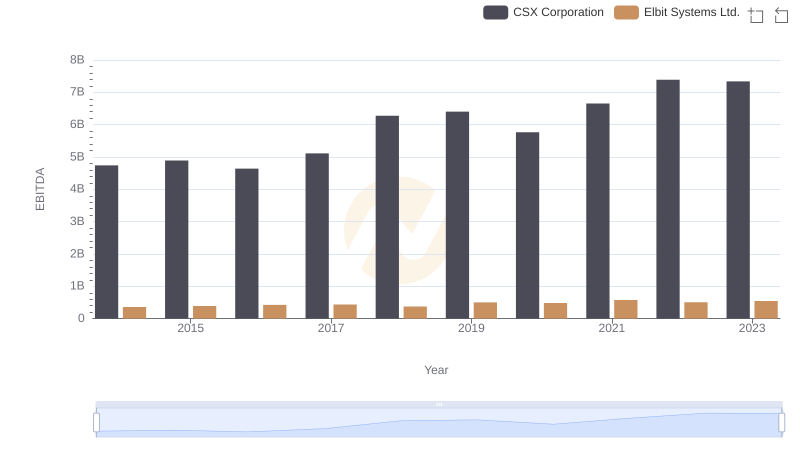
CSX Corporation vs Elbit Systems Ltd.: In-Depth EBITDA Performance Comparison
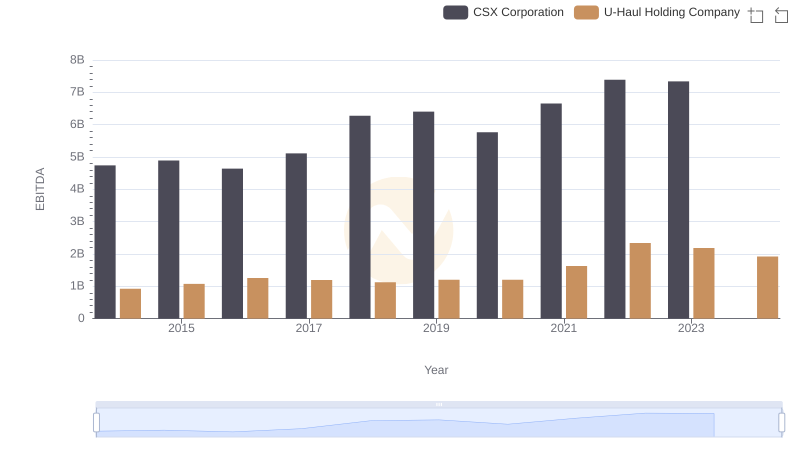
CSX Corporation vs U-Haul Holding Company: In-Depth EBITDA Performance Comparison
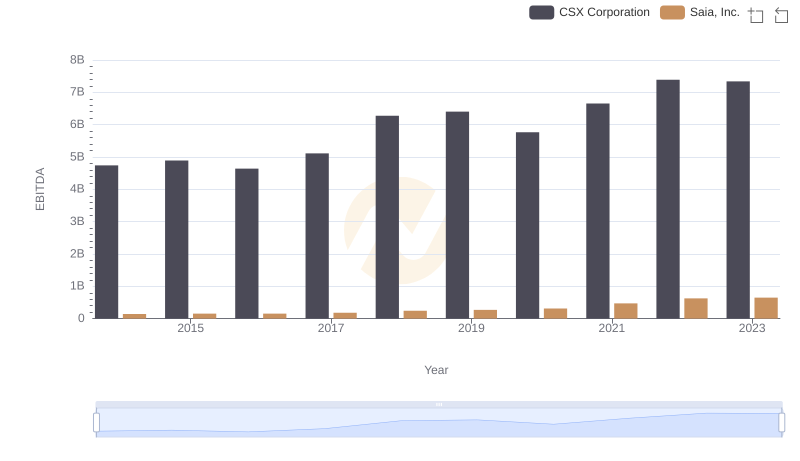
EBITDA Performance Review: CSX Corporation vs Saia, Inc.
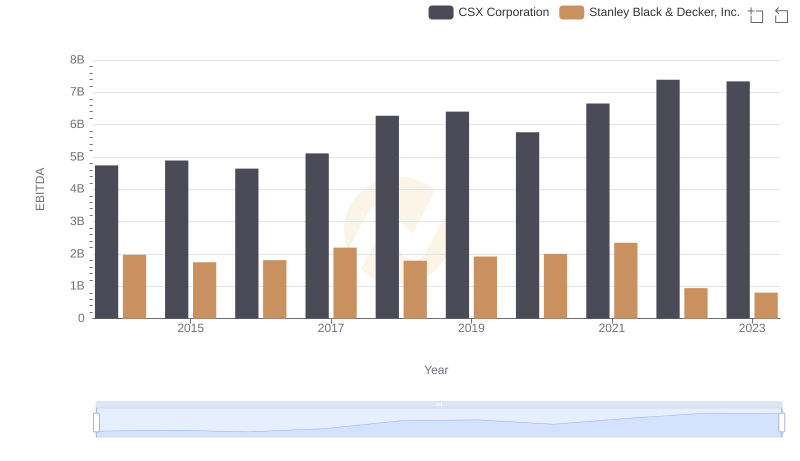
A Professional Review of EBITDA: CSX Corporation Compared to Stanley Black & Decker, Inc.
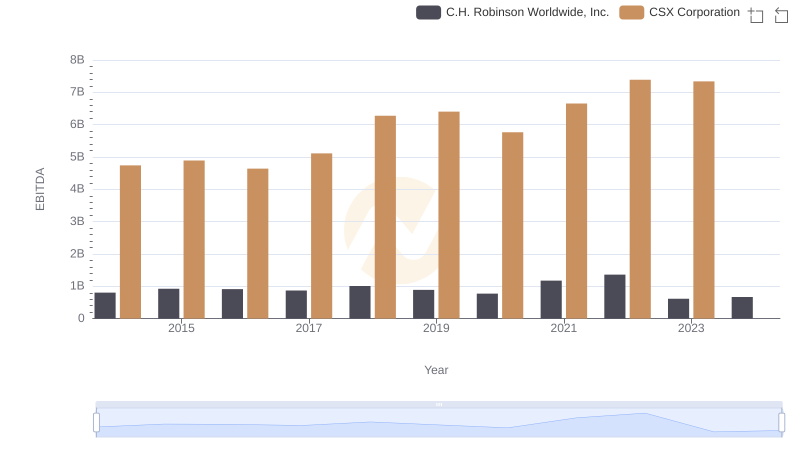
A Professional Review of EBITDA: CSX Corporation Compared to C.H. Robinson Worldwide, Inc.
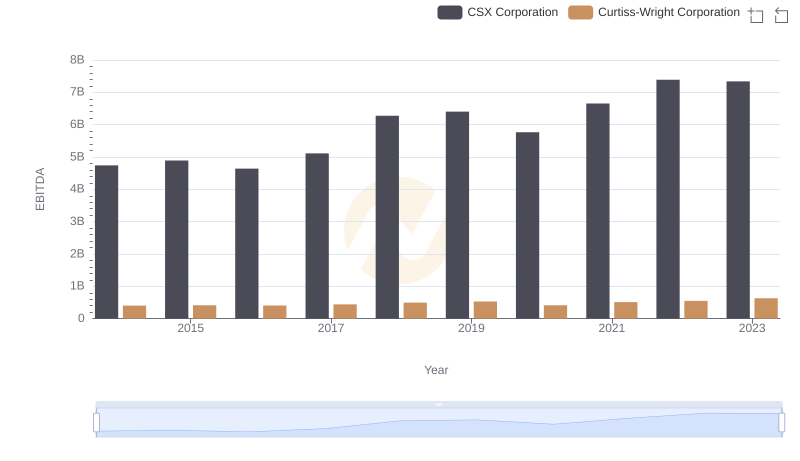
CSX Corporation and Curtiss-Wright Corporation: A Detailed Examination of EBITDA Performance