| __timestamp | CSX Corporation | Stanley Black & Decker, Inc. |
|---|---|---|
| Wednesday, January 1, 2014 | 4740000000 | 1975400000 |
| Thursday, January 1, 2015 | 4890000000 | 1741900000 |
| Friday, January 1, 2016 | 4640000000 | 1810200000 |
| Sunday, January 1, 2017 | 5113000000 | 2196000000 |
| Monday, January 1, 2018 | 6274000000 | 1791200000 |
| Tuesday, January 1, 2019 | 6402000000 | 1920600000 |
| Wednesday, January 1, 2020 | 5764000000 | 2004200000 |
| Friday, January 1, 2021 | 6653000000 | 2345500000 |
| Saturday, January 1, 2022 | 7390000000 | 942800000 |
| Sunday, January 1, 2023 | 7340000000 | 802700000 |
| Monday, January 1, 2024 | 286300000 |
Unleashing the power of data
In the world of corporate finance, EBITDA (Earnings Before Interest, Taxes, Depreciation, and Amortization) serves as a crucial indicator of a company's operational performance. Over the past decade, CSX Corporation and Stanley Black & Decker, Inc. have showcased contrasting trajectories in their EBITDA figures.
From 2014 to 2023, CSX Corporation has demonstrated a robust growth trend, with its EBITDA increasing by approximately 55%, peaking in 2022. This growth reflects CSX's strategic initiatives and operational efficiencies in the transportation sector. In contrast, Stanley Black & Decker, Inc. experienced a more volatile journey, with a notable decline of around 60% in EBITDA by 2023. This downturn highlights the challenges faced by the company in the competitive tools and storage industry.
These insights provide a compelling narrative of how industry dynamics and strategic decisions shape financial outcomes.
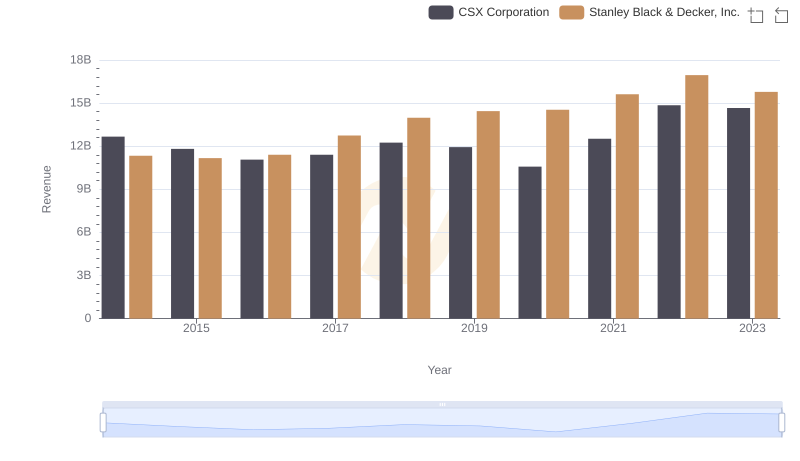
Revenue Insights: CSX Corporation and Stanley Black & Decker, Inc. Performance Compared
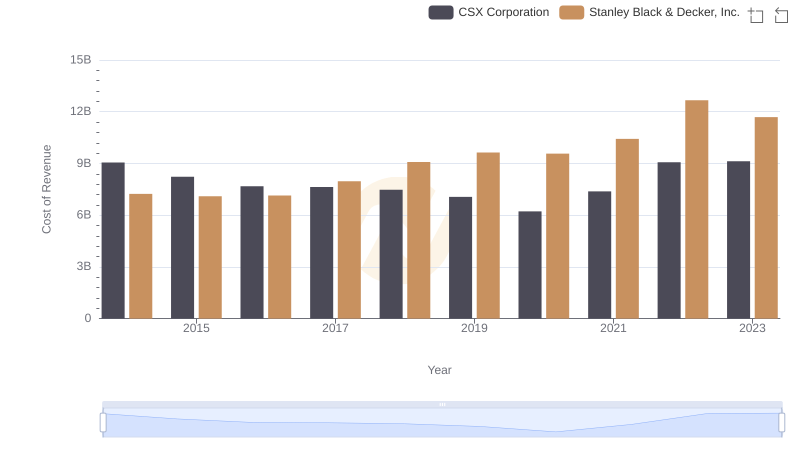
Cost Insights: Breaking Down CSX Corporation and Stanley Black & Decker, Inc.'s Expenses

Breaking Down Revenue Trends: CSX Corporation vs Stanley Black & Decker, Inc.
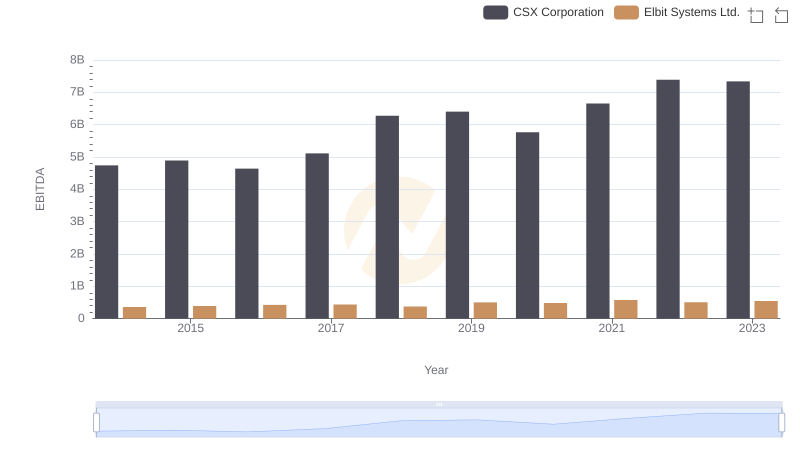
CSX Corporation vs Elbit Systems Ltd.: In-Depth EBITDA Performance Comparison
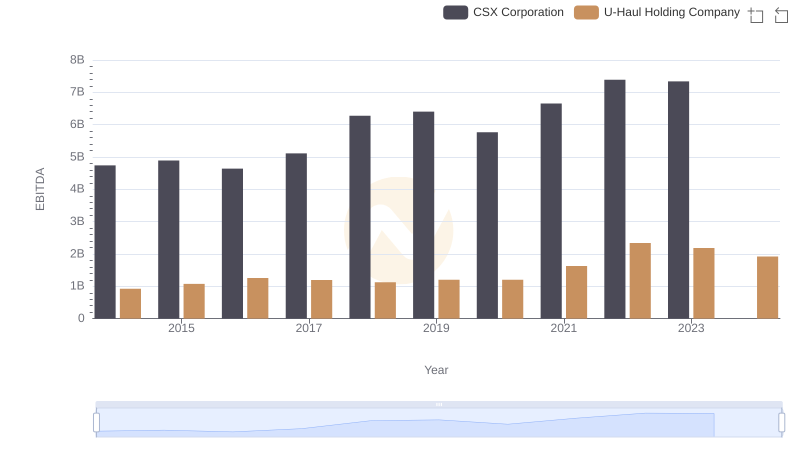
CSX Corporation vs U-Haul Holding Company: In-Depth EBITDA Performance Comparison
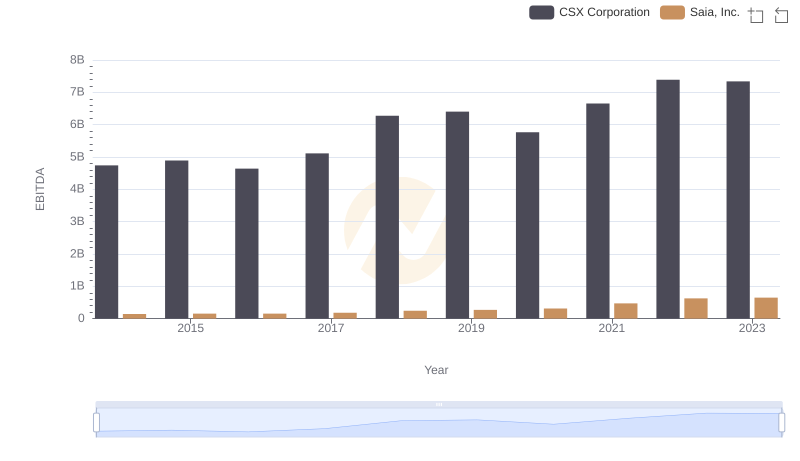
EBITDA Performance Review: CSX Corporation vs Saia, Inc.
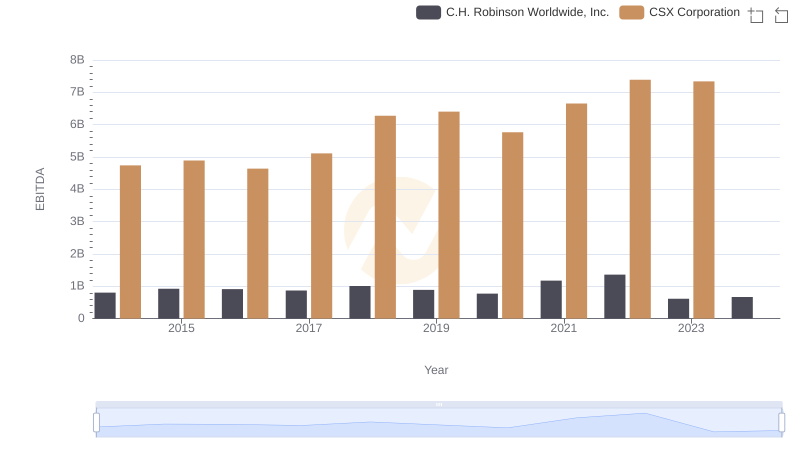
A Professional Review of EBITDA: CSX Corporation Compared to C.H. Robinson Worldwide, Inc.
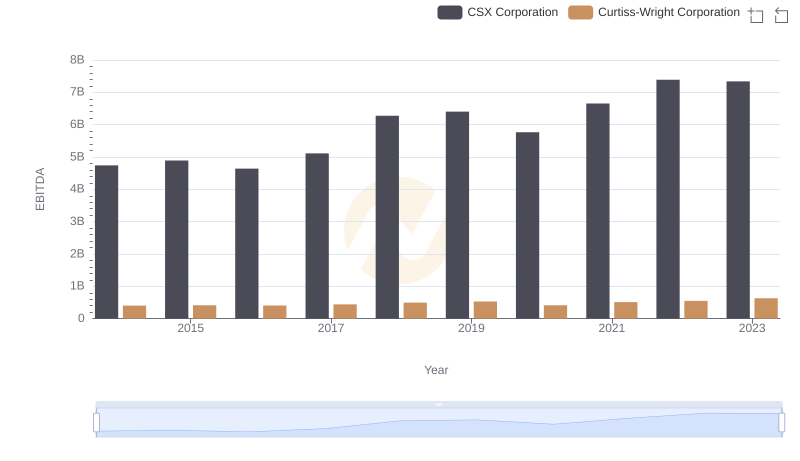
CSX Corporation and Curtiss-Wright Corporation: A Detailed Examination of EBITDA Performance