| __timestamp | CSX Corporation | Comfort Systems USA, Inc. |
|---|---|---|
| Wednesday, January 1, 2014 | 4740000000 | 63455000 |
| Thursday, January 1, 2015 | 4890000000 | 112580000 |
| Friday, January 1, 2016 | 4640000000 | 126974000 |
| Sunday, January 1, 2017 | 5113000000 | 137151000 |
| Monday, January 1, 2018 | 6274000000 | 191982000 |
| Tuesday, January 1, 2019 | 6402000000 | 229518000 |
| Wednesday, January 1, 2020 | 5764000000 | 276904000 |
| Friday, January 1, 2021 | 6653000000 | 282506000 |
| Saturday, January 1, 2022 | 7390000000 | 352446000 |
| Sunday, January 1, 2023 | 7340000000 | 497652000 |
Infusing magic into the data realm
In the world of finance, EBITDA (Earnings Before Interest, Taxes, Depreciation, and Amortization) serves as a crucial indicator of a company's operational performance. Over the past decade, CSX Corporation and Comfort Systems USA, Inc. have shown contrasting trajectories in their EBITDA growth.
From 2014 to 2023, CSX Corporation's EBITDA surged by approximately 55%, peaking in 2022 with a remarkable 7.39 billion. This growth reflects CSX's strategic initiatives and robust market positioning in the transportation sector. In contrast, Comfort Systems USA, Inc., a leader in mechanical systems installation, experienced a more modest yet steady increase of around 684%, reaching nearly 498 million in 2023.
This comparison highlights the diverse growth strategies and market dynamics influencing these two industry giants. As investors and analysts look to the future, understanding these trends is essential for making informed decisions.
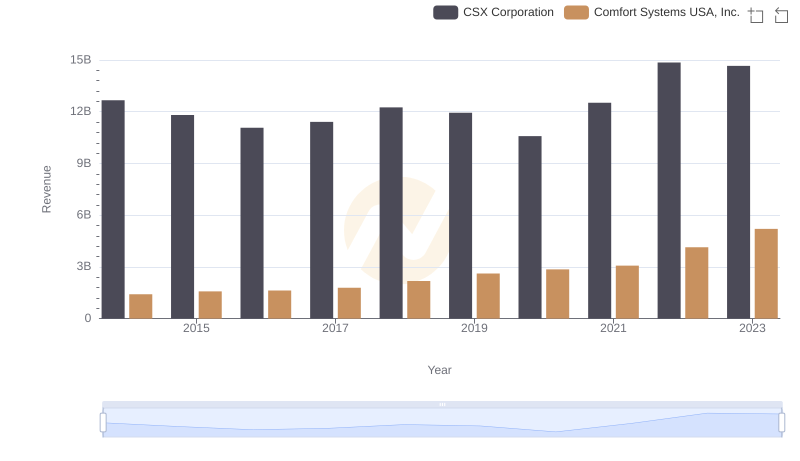
CSX Corporation and Comfort Systems USA, Inc.: A Comprehensive Revenue Analysis
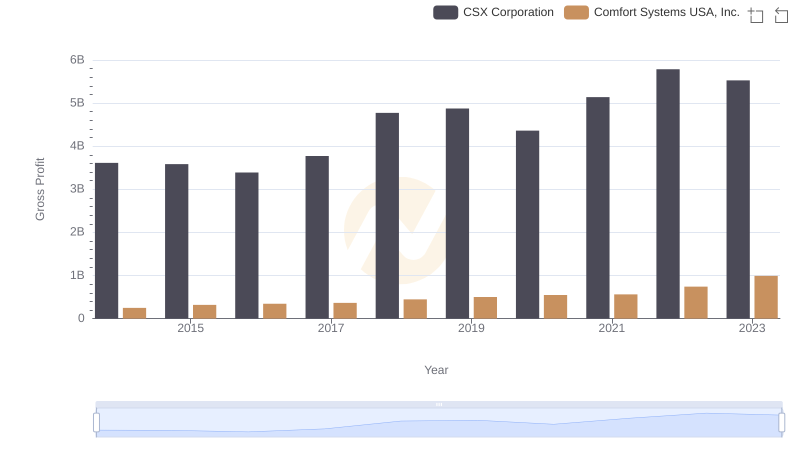
Gross Profit Trends Compared: CSX Corporation vs Comfort Systems USA, Inc.
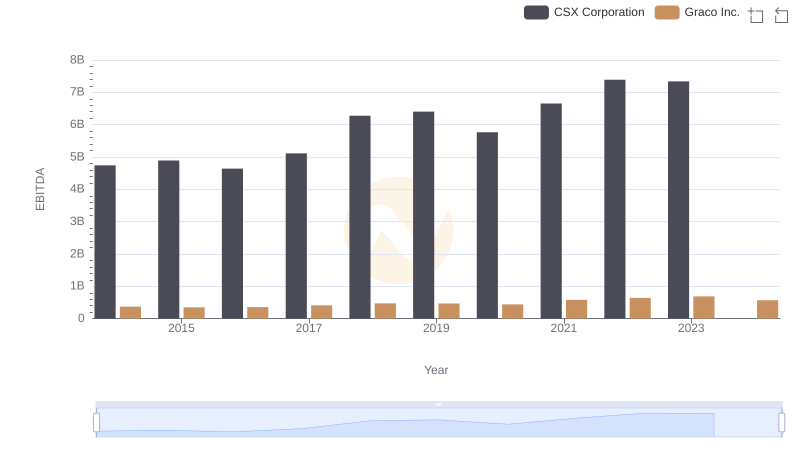
EBITDA Metrics Evaluated: CSX Corporation vs Graco Inc.
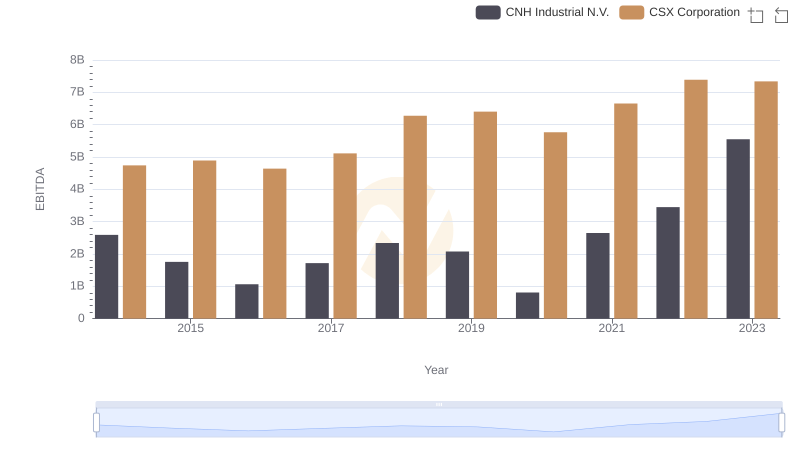
CSX Corporation and CNH Industrial N.V.: A Detailed Examination of EBITDA Performance
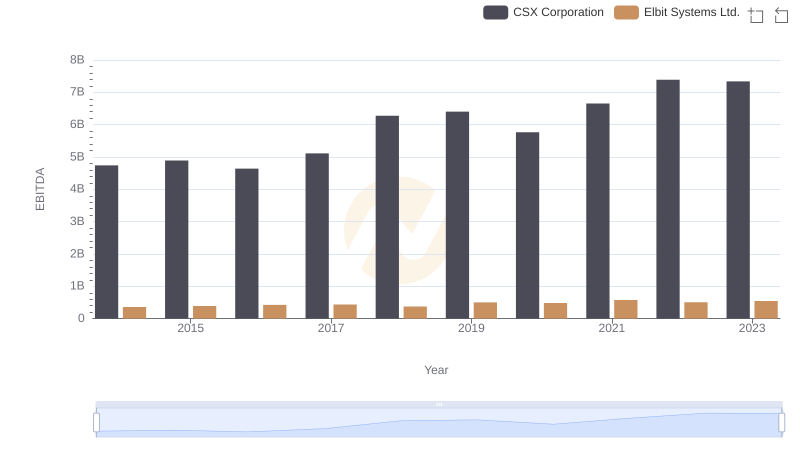
CSX Corporation vs Elbit Systems Ltd.: In-Depth EBITDA Performance Comparison
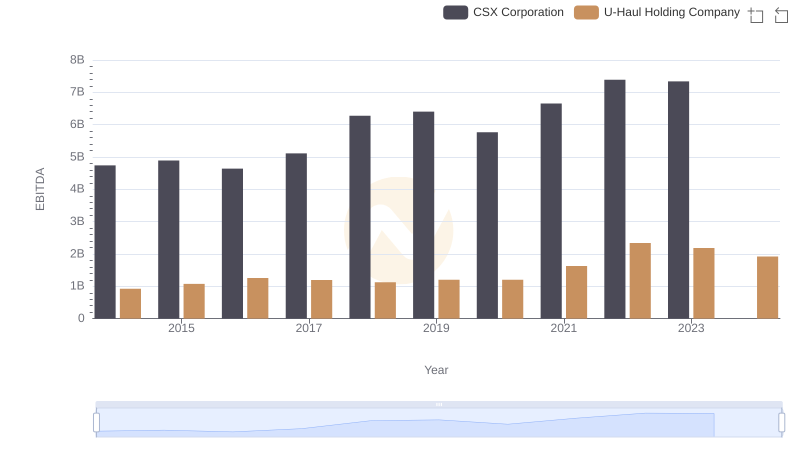
CSX Corporation vs U-Haul Holding Company: In-Depth EBITDA Performance Comparison
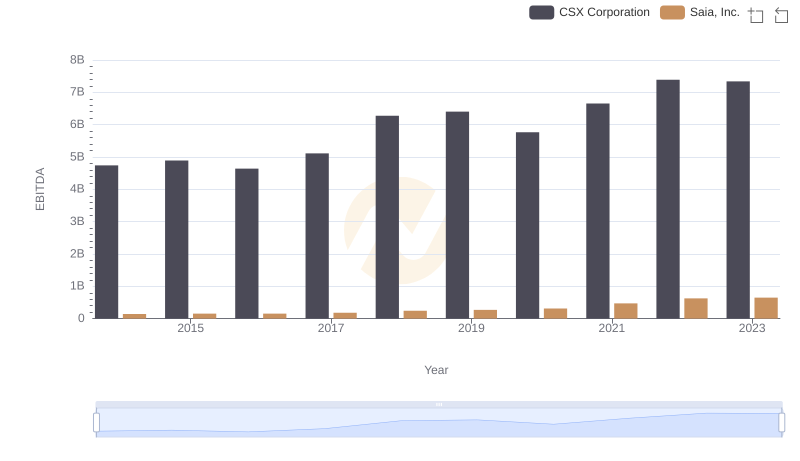
EBITDA Performance Review: CSX Corporation vs Saia, Inc.