| __timestamp | C.H. Robinson Worldwide, Inc. | CSX Corporation |
|---|---|---|
| Wednesday, January 1, 2014 | 805427000 | 4740000000 |
| Thursday, January 1, 2015 | 924719000 | 4890000000 |
| Friday, January 1, 2016 | 912200000 | 4640000000 |
| Sunday, January 1, 2017 | 868096000 | 5113000000 |
| Monday, January 1, 2018 | 1008812000 | 6274000000 |
| Tuesday, January 1, 2019 | 890425000 | 6402000000 |
| Wednesday, January 1, 2020 | 774995000 | 5764000000 |
| Friday, January 1, 2021 | 1173367000 | 6653000000 |
| Saturday, January 1, 2022 | 1359558000 | 7390000000 |
| Sunday, January 1, 2023 | 613592000 | 7340000000 |
| Monday, January 1, 2024 | 766301000 |
Unleashing the power of data
In the ever-evolving landscape of American business, understanding the financial health of industry giants is crucial. This analysis delves into the EBITDA performance of CSX Corporation and C.H. Robinson Worldwide, Inc. over the past decade.
From 2014 to 2023, CSX Corporation consistently outperformed C.H. Robinson, with EBITDA figures peaking in 2022 at approximately $7.39 billion, a 57% increase from 2014. In contrast, C.H. Robinson's EBITDA reached its zenith in 2022, with a 69% rise from 2014, before experiencing a significant drop in 2023.
The data reveals a robust growth trajectory for CSX, while C.H. Robinson faced volatility, particularly in recent years. This comparison underscores the resilience of CSX in the transportation sector, while highlighting challenges faced by C.H. Robinson in logistics. Missing data for 2024 suggests potential uncertainties ahead.
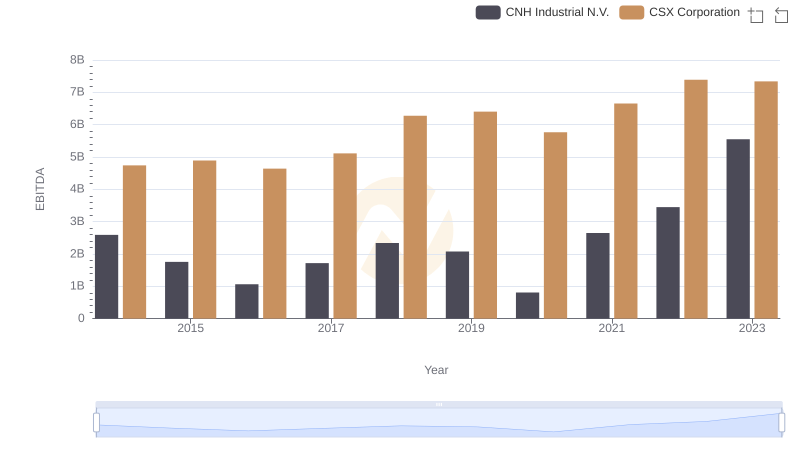
CSX Corporation and CNH Industrial N.V.: A Detailed Examination of EBITDA Performance
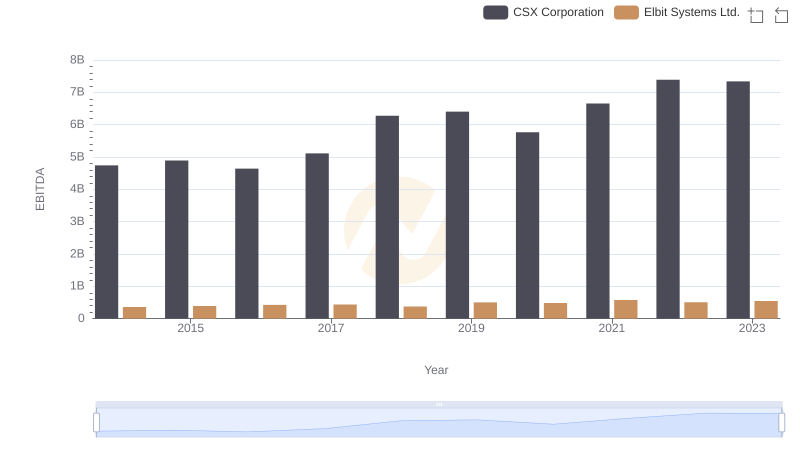
CSX Corporation vs Elbit Systems Ltd.: In-Depth EBITDA Performance Comparison
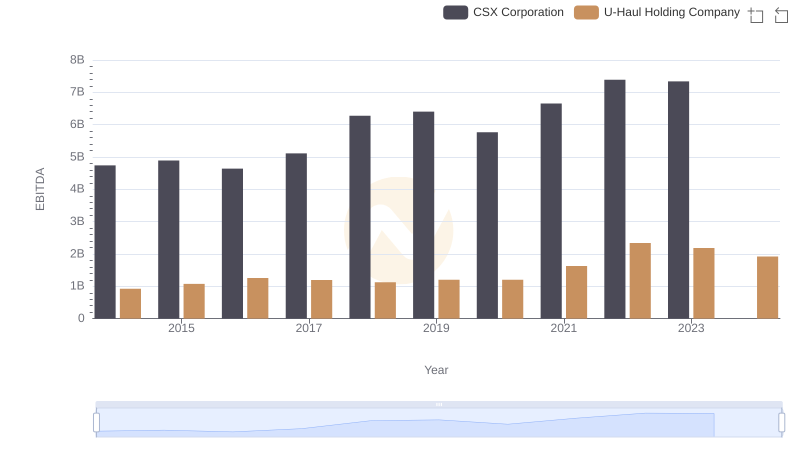
CSX Corporation vs U-Haul Holding Company: In-Depth EBITDA Performance Comparison
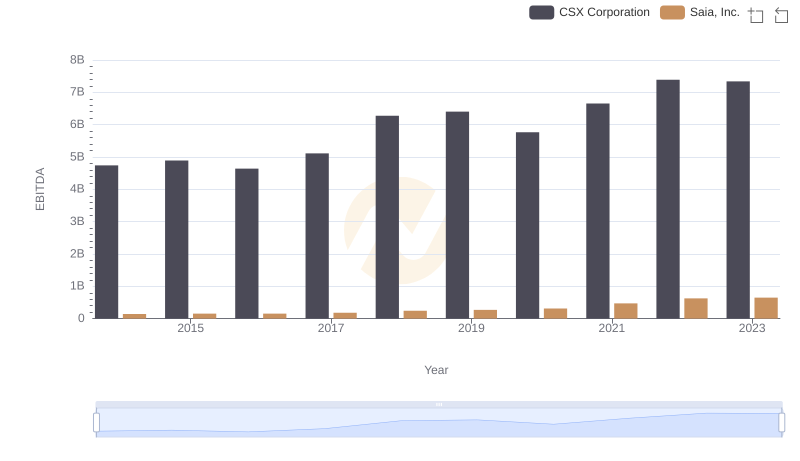
EBITDA Performance Review: CSX Corporation vs Saia, Inc.
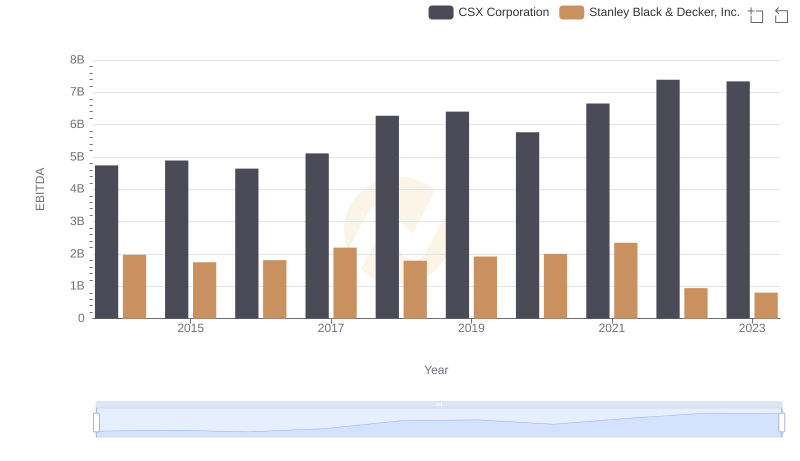
A Professional Review of EBITDA: CSX Corporation Compared to Stanley Black & Decker, Inc.
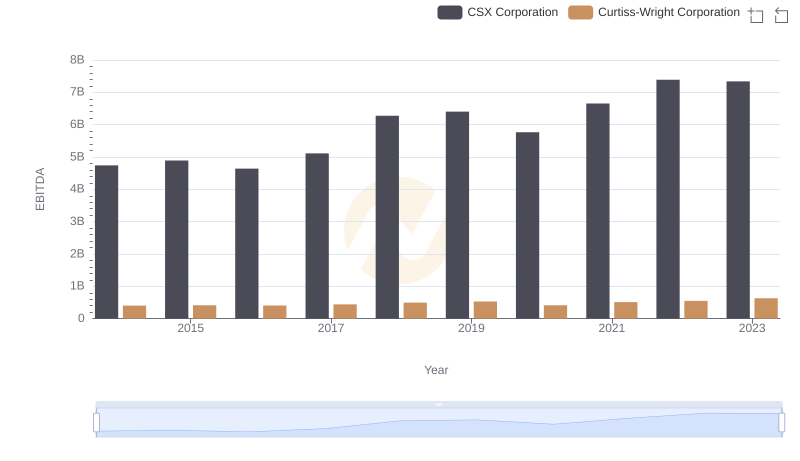
CSX Corporation and Curtiss-Wright Corporation: A Detailed Examination of EBITDA Performance
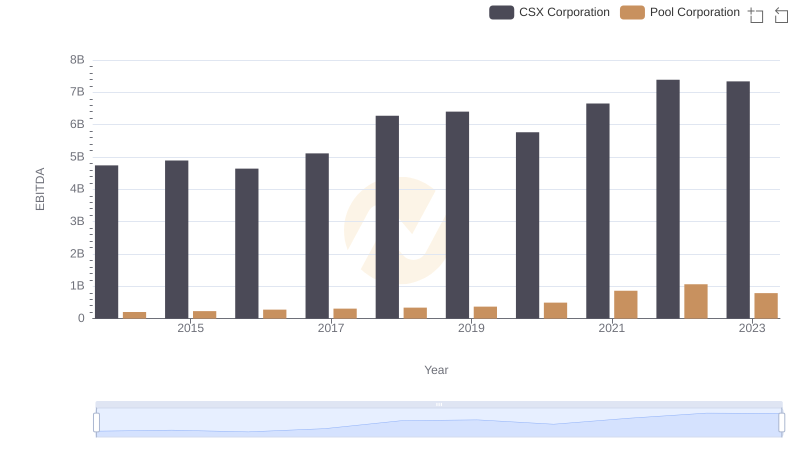
EBITDA Performance Review: CSX Corporation vs Pool Corporation