| __timestamp | CSX Corporation | Elbit Systems Ltd. |
|---|---|---|
| Wednesday, January 1, 2014 | 4740000000 | 358274000 |
| Thursday, January 1, 2015 | 4890000000 | 390932000 |
| Friday, January 1, 2016 | 4640000000 | 424003291 |
| Sunday, January 1, 2017 | 5113000000 | 438616108 |
| Monday, January 1, 2018 | 6274000000 | 374866620 |
| Tuesday, January 1, 2019 | 6402000000 | 502866000 |
| Wednesday, January 1, 2020 | 5764000000 | 484464000 |
| Friday, January 1, 2021 | 6653000000 | 576645646 |
| Saturday, January 1, 2022 | 7390000000 | 505269000 |
| Sunday, January 1, 2023 | 7340000000 | 544811000 |
Unleashing the power of data
In the world of corporate finance, EBITDA serves as a crucial indicator of a company's operational performance. Over the past decade, CSX Corporation and Elbit Systems Ltd. have showcased contrasting trajectories in their EBITDA growth. From 2014 to 2023, CSX Corporation's EBITDA surged by approximately 55%, reflecting its robust operational strategies and market adaptability. In contrast, Elbit Systems Ltd. experienced a more modest growth of around 52%, highlighting its steady yet less aggressive expansion.
This comparison underscores the dynamic nature of these industries, with CSX Corporation capitalizing on its strategic initiatives, while Elbit Systems Ltd. maintains a consistent growth trajectory.
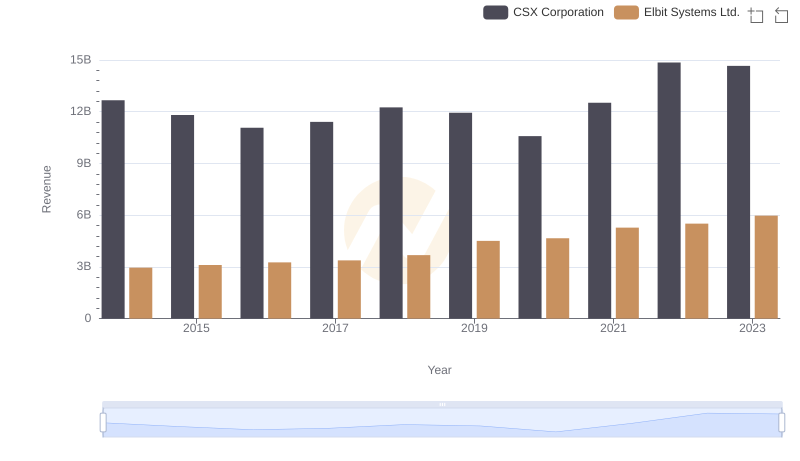
CSX Corporation vs Elbit Systems Ltd.: Annual Revenue Growth Compared
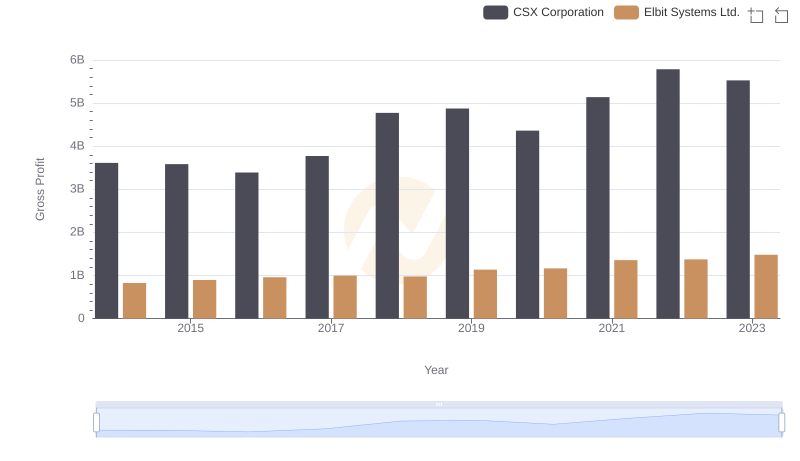
Gross Profit Trends Compared: CSX Corporation vs Elbit Systems Ltd.
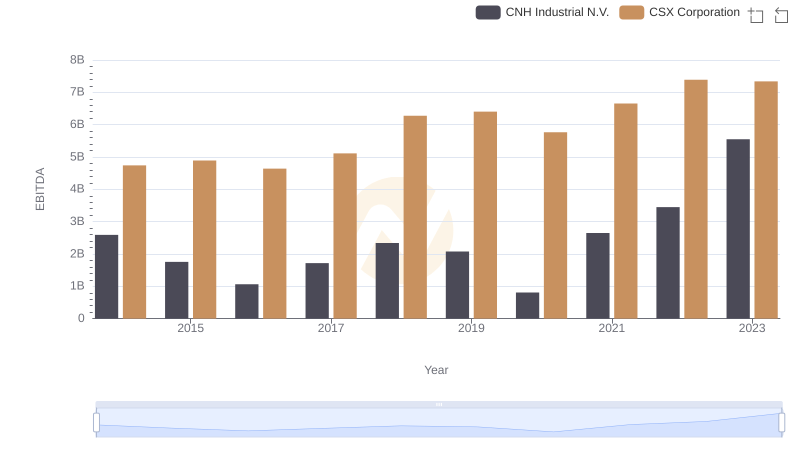
CSX Corporation and CNH Industrial N.V.: A Detailed Examination of EBITDA Performance
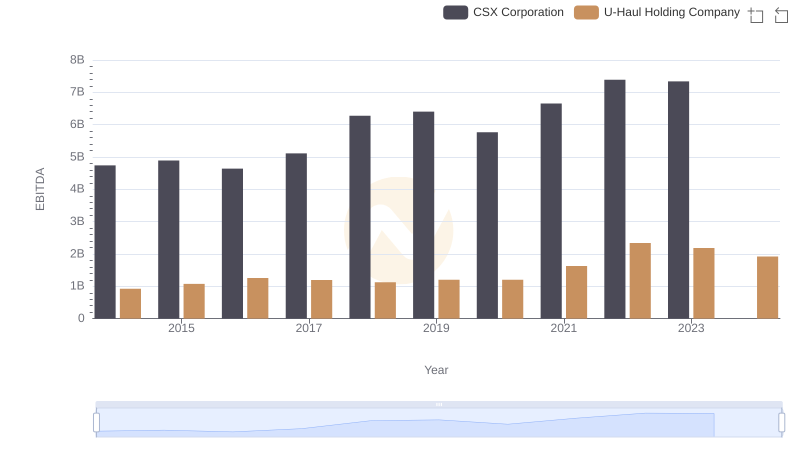
CSX Corporation vs U-Haul Holding Company: In-Depth EBITDA Performance Comparison
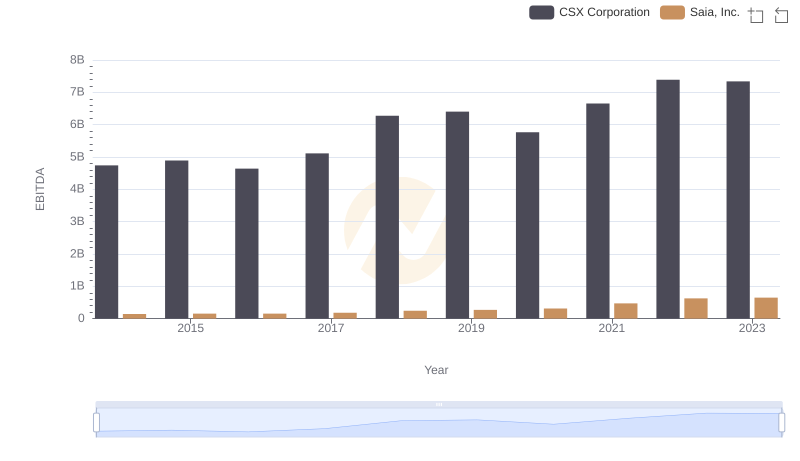
EBITDA Performance Review: CSX Corporation vs Saia, Inc.
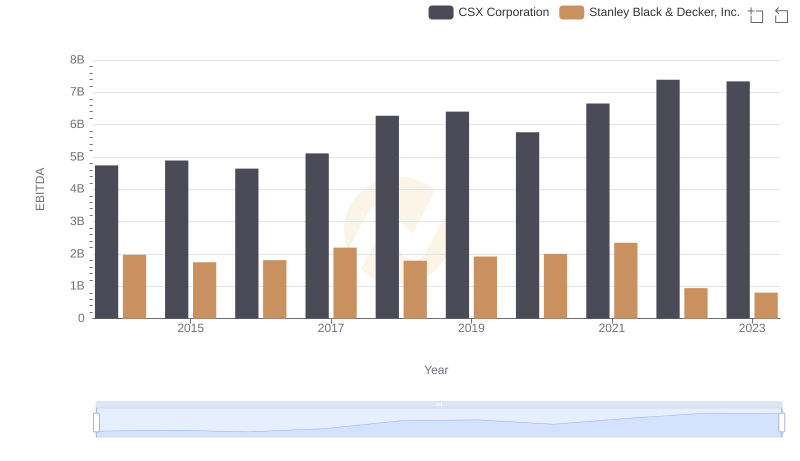
A Professional Review of EBITDA: CSX Corporation Compared to Stanley Black & Decker, Inc.
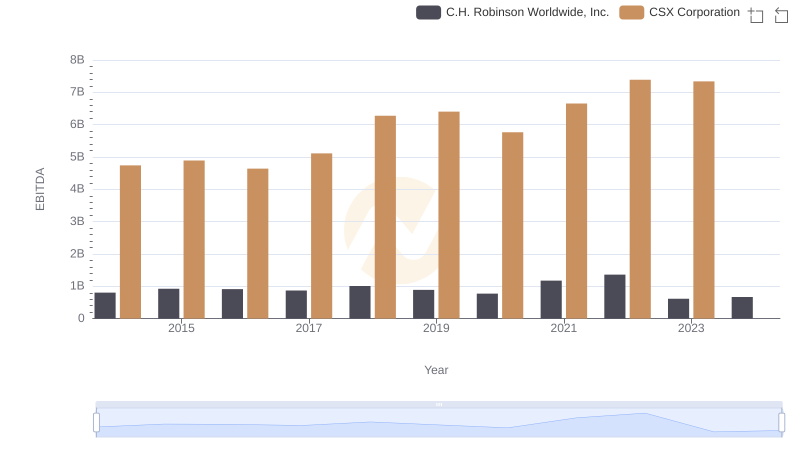
A Professional Review of EBITDA: CSX Corporation Compared to C.H. Robinson Worldwide, Inc.
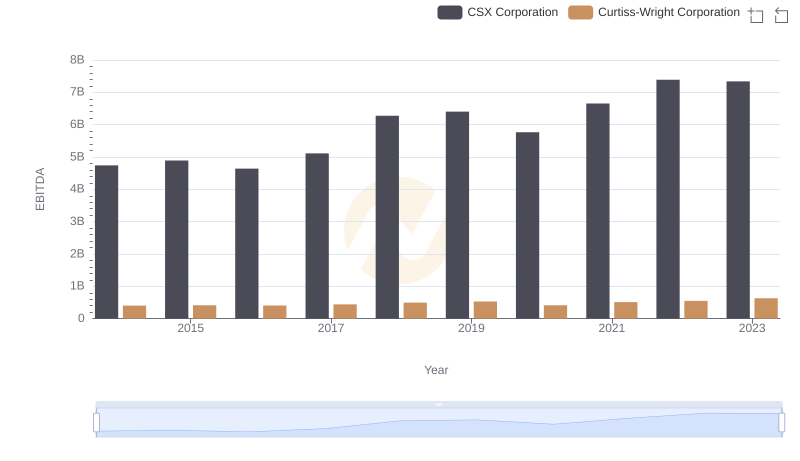
CSX Corporation and Curtiss-Wright Corporation: A Detailed Examination of EBITDA Performance
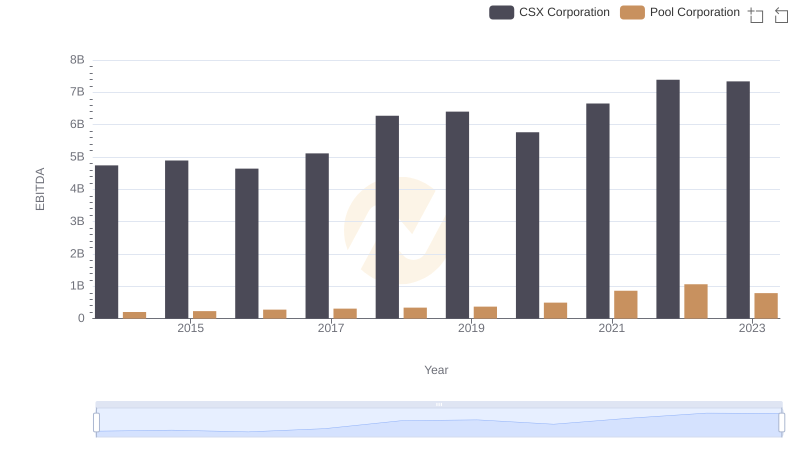
EBITDA Performance Review: CSX Corporation vs Pool Corporation