| __timestamp | CNH Industrial N.V. | CSX Corporation |
|---|---|---|
| Wednesday, January 1, 2014 | 25534000000 | 9056000000 |
| Thursday, January 1, 2015 | 20357000000 | 8227000000 |
| Friday, January 1, 2016 | 19539000000 | 7680000000 |
| Sunday, January 1, 2017 | 21621000000 | 7635000000 |
| Monday, January 1, 2018 | 22958000000 | 7477000000 |
| Tuesday, January 1, 2019 | 21832000000 | 7063000000 |
| Wednesday, January 1, 2020 | 21327000000 | 6221000000 |
| Friday, January 1, 2021 | 25951000000 | 7382000000 |
| Saturday, January 1, 2022 | 16797000000 | 9068000000 |
| Sunday, January 1, 2023 | 16805000000 | 9130000000 |
Unlocking the unknown
In the ever-evolving landscape of industrial giants, understanding cost structures is pivotal. Over the past decade, CSX Corporation and CNH Industrial N.V. have showcased intriguing trends in their cost of revenue. From 2014 to 2023, CNH Industrial N.V. experienced a notable 34% decline in costs, dropping from a peak in 2014 to a low in 2022. Meanwhile, CSX Corporation maintained a more stable trajectory, with costs fluctuating modestly around the $8 billion mark, peaking in 2023. This stability reflects CSX's strategic cost management amidst industry challenges. The data reveals a compelling narrative of how these corporations navigate financial pressures, offering insights into their operational efficiencies and market strategies. As we delve deeper into these figures, the contrasting cost dynamics between these two industry leaders provide a window into their competitive positioning and future growth potential.
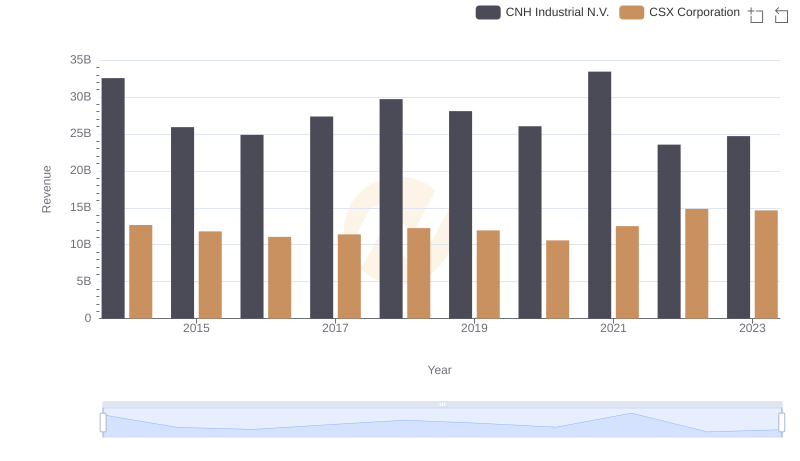
CSX Corporation vs CNH Industrial N.V.: Annual Revenue Growth Compared
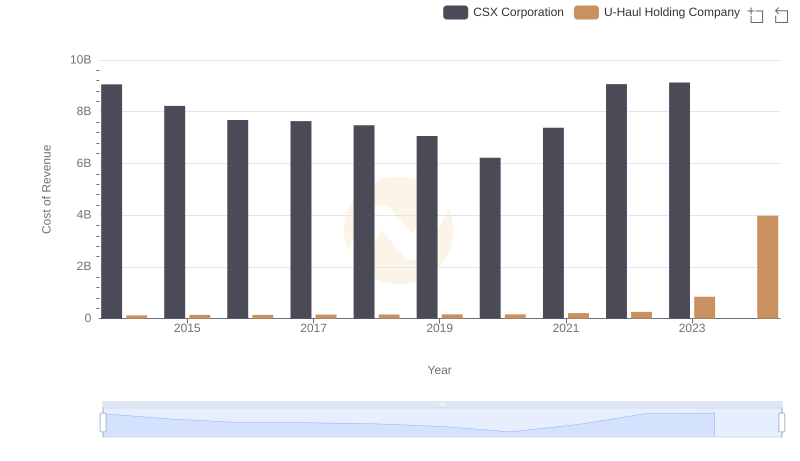
Cost Insights: Breaking Down CSX Corporation and U-Haul Holding Company's Expenses
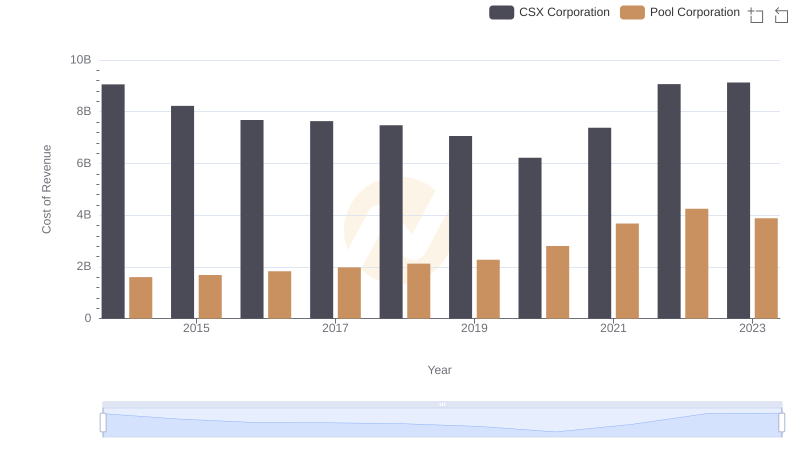
Comparing Cost of Revenue Efficiency: CSX Corporation vs Pool Corporation
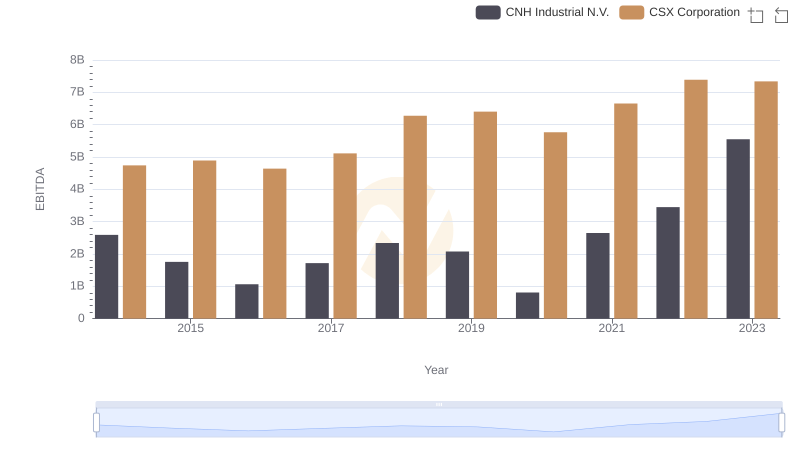
CSX Corporation and CNH Industrial N.V.: A Detailed Examination of EBITDA Performance