| __timestamp | CSX Corporation | U-Haul Holding Company |
|---|---|---|
| Wednesday, January 1, 2014 | 4740000000 | 923383000 |
| Thursday, January 1, 2015 | 4890000000 | 1076520000 |
| Friday, January 1, 2016 | 4640000000 | 1255474000 |
| Sunday, January 1, 2017 | 5113000000 | 1195593000 |
| Monday, January 1, 2018 | 6274000000 | 1123974000 |
| Tuesday, January 1, 2019 | 6402000000 | 1200955000 |
| Wednesday, January 1, 2020 | 5764000000 | 1202436000 |
| Friday, January 1, 2021 | 6653000000 | 1627442000 |
| Saturday, January 1, 2022 | 7390000000 | 2337788000 |
| Sunday, January 1, 2023 | 7340000000 | 2183839000 |
| Monday, January 1, 2024 | 1919656000 |
Unveiling the hidden dimensions of data
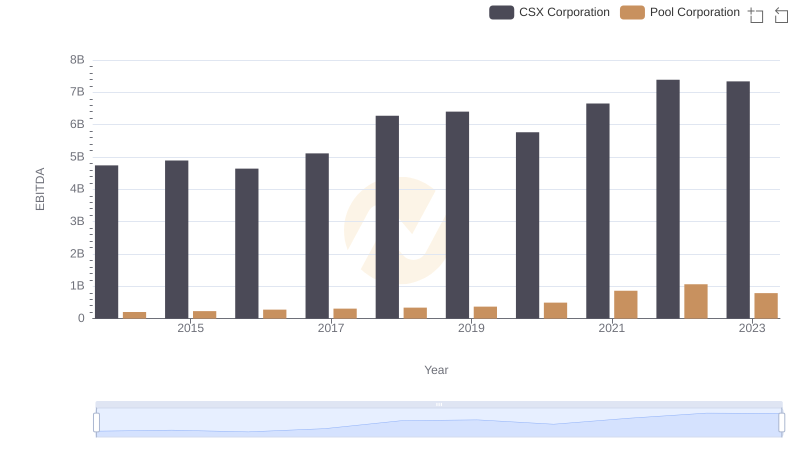
In the ever-evolving landscape of American business, the financial performance of industry giants like CSX Corporation and U-Haul Holding Company offers a fascinating glimpse into their strategic prowess. Over the past decade, CSX Corporation has consistently outperformed U-Haul in terms of EBITDA, showcasing a robust growth trajectory. From 2014 to 2023, CSX's EBITDA surged by approximately 55%, peaking in 2022. In contrast, U-Haul's EBITDA, while growing, displayed a more modest increase of around 137% over the same period.
The data for 2024 remains incomplete, leaving room for speculation on future trends. This comparison underscores the dynamic nature of corporate financial strategies in the U.S.
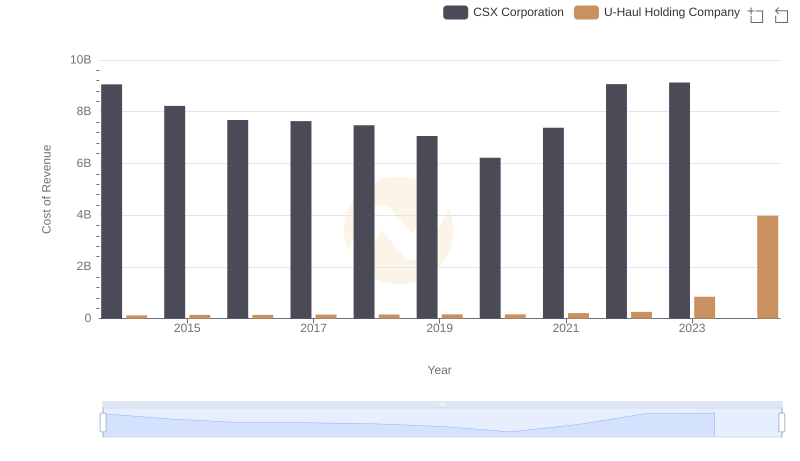
Cost Insights: Breaking Down CSX Corporation and U-Haul Holding Company's Expenses
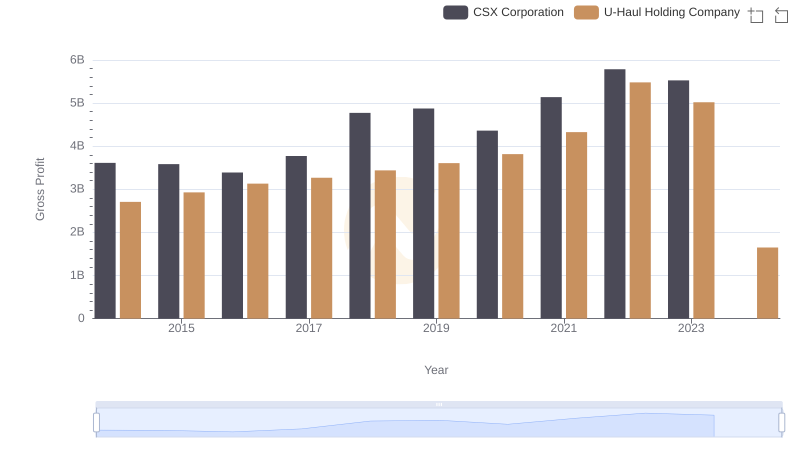
CSX Corporation vs U-Haul Holding Company: A Gross Profit Performance Breakdown
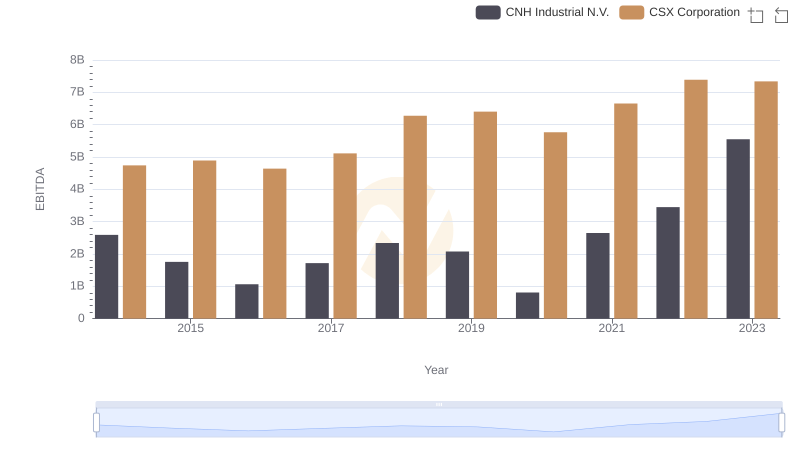
CSX Corporation and CNH Industrial N.V.: A Detailed Examination of EBITDA Performance
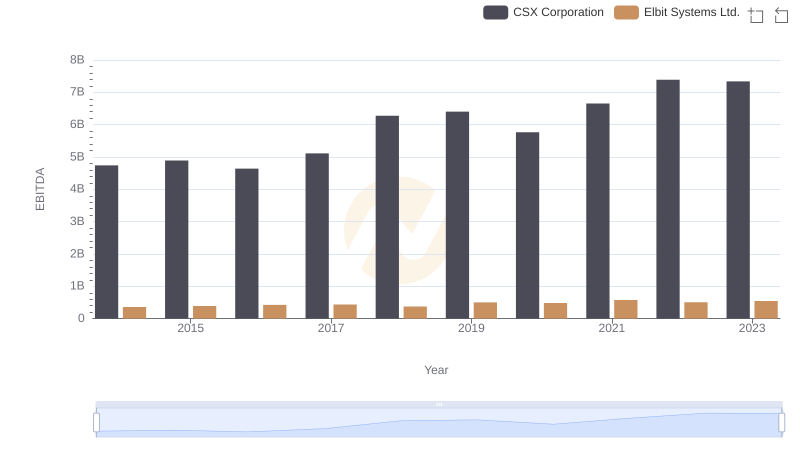
CSX Corporation vs Elbit Systems Ltd.: In-Depth EBITDA Performance Comparison
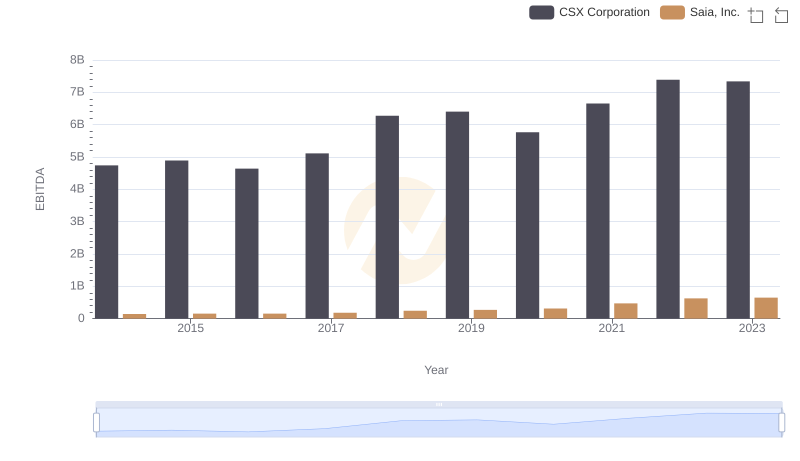
EBITDA Performance Review: CSX Corporation vs Saia, Inc.
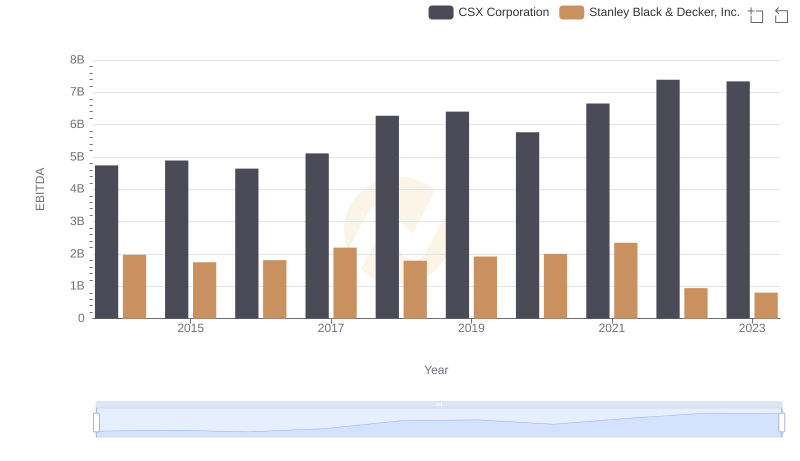
A Professional Review of EBITDA: CSX Corporation Compared to Stanley Black & Decker, Inc.
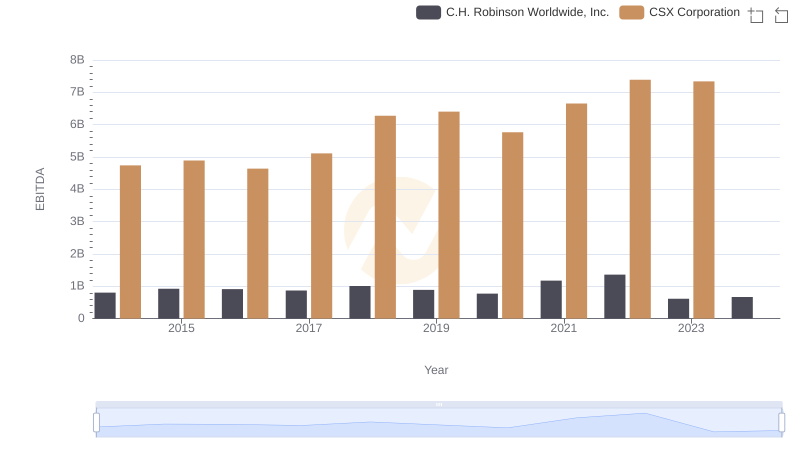
A Professional Review of EBITDA: CSX Corporation Compared to C.H. Robinson Worldwide, Inc.
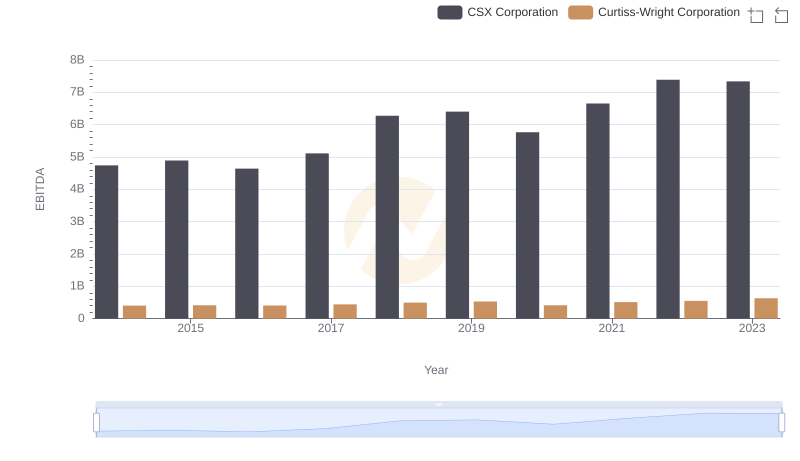
CSX Corporation and Curtiss-Wright Corporation: A Detailed Examination of EBITDA Performance
EBITDA Performance Review: CSX Corporation vs Pool Corporation