| __timestamp | CNH Industrial N.V. | CSX Corporation |
|---|---|---|
| Wednesday, January 1, 2014 | 32555000000 | 12669000000 |
| Thursday, January 1, 2015 | 25912000000 | 11811000000 |
| Friday, January 1, 2016 | 24872000000 | 11069000000 |
| Sunday, January 1, 2017 | 27361000000 | 11408000000 |
| Monday, January 1, 2018 | 29706000000 | 12250000000 |
| Tuesday, January 1, 2019 | 28079000000 | 11937000000 |
| Wednesday, January 1, 2020 | 26032000000 | 10583000000 |
| Friday, January 1, 2021 | 33428000000 | 12522000000 |
| Saturday, January 1, 2022 | 23551000000 | 14853000000 |
| Sunday, January 1, 2023 | 24694000000 | 14657000000 |
Unleashing the power of data
In the ever-evolving landscape of industrial giants, CSX Corporation and CNH Industrial N.V. have showcased intriguing revenue trajectories over the past decade. From 2014 to 2023, CSX Corporation's revenue grew by approximately 16%, peaking in 2022 with a 40% increase from its 2020 low. Meanwhile, CNH Industrial N.V. experienced a more volatile journey, with a notable dip in 2022, marking a 30% decrease from its 2021 high. However, by 2023, CNH Industrial N.V. began to recover, showing a 5% increase from the previous year. This comparison highlights the resilience and adaptability of these industry leaders amidst global economic shifts. As we delve into their financial narratives, it becomes evident that strategic pivots and market dynamics play crucial roles in shaping their annual revenue growth.
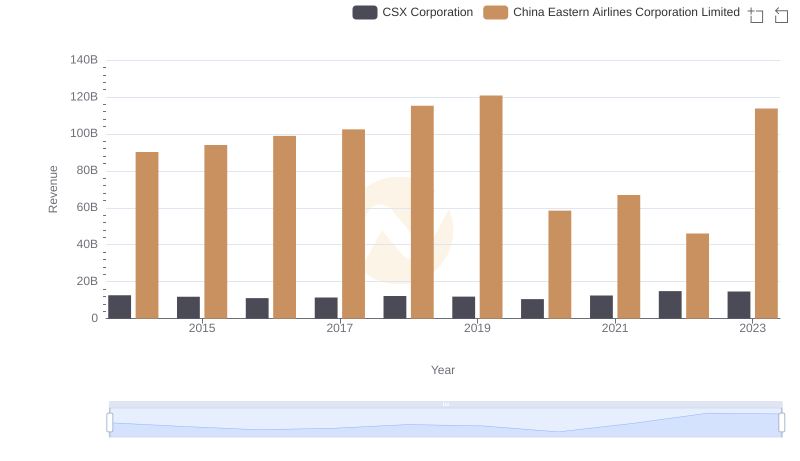
CSX Corporation and China Eastern Airlines Corporation Limited: A Comprehensive Revenue Analysis

Breaking Down Revenue Trends: CSX Corporation vs Avery Dennison Corporation
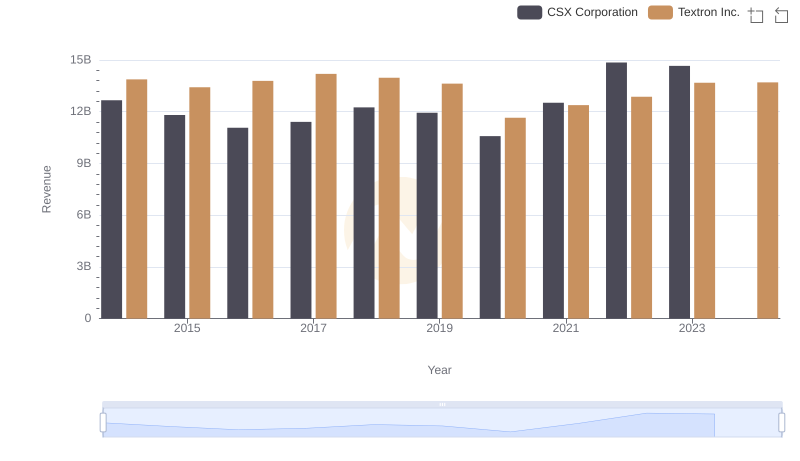
Who Generates More Revenue? CSX Corporation or Textron Inc.
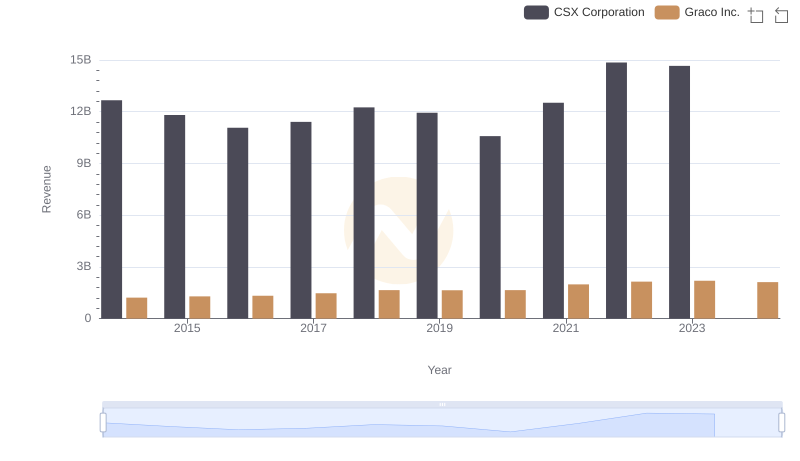
Who Generates More Revenue? CSX Corporation or Graco Inc.
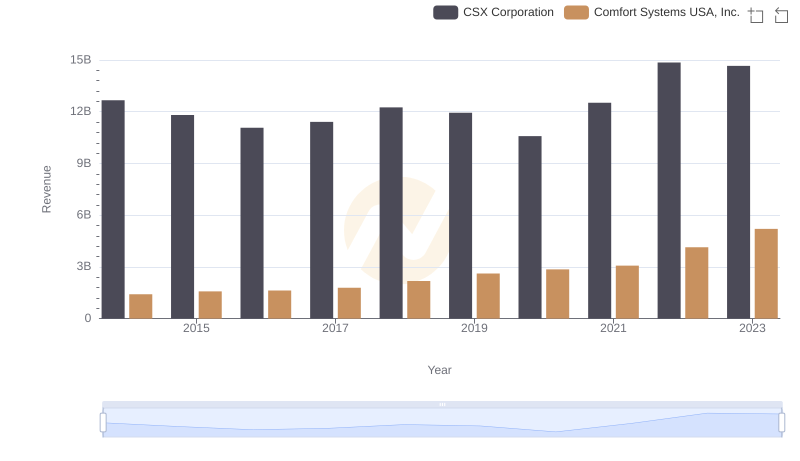
CSX Corporation and Comfort Systems USA, Inc.: A Comprehensive Revenue Analysis
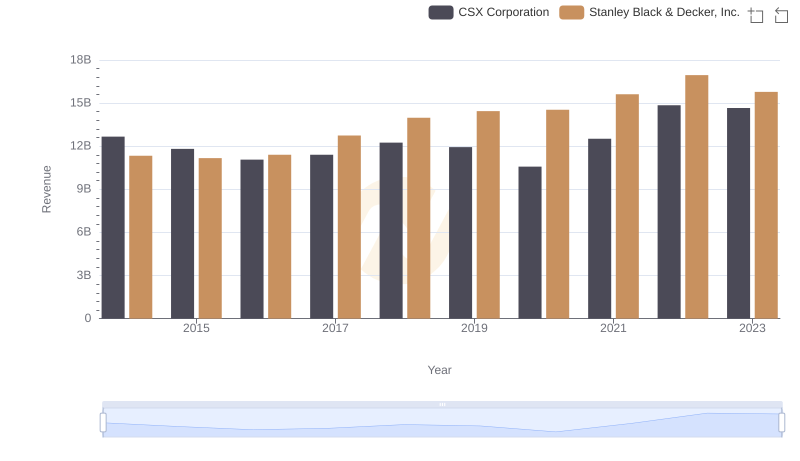
Breaking Down Revenue Trends: CSX Corporation vs Stanley Black & Decker, Inc.
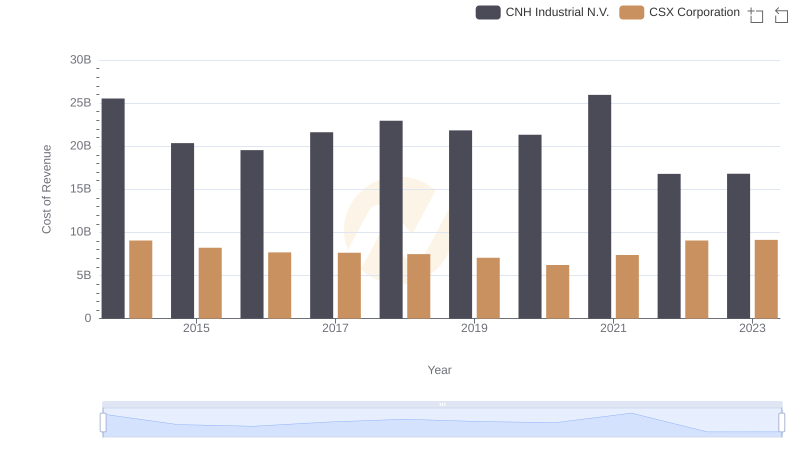
Cost Insights: Breaking Down CSX Corporation and CNH Industrial N.V.'s Expenses
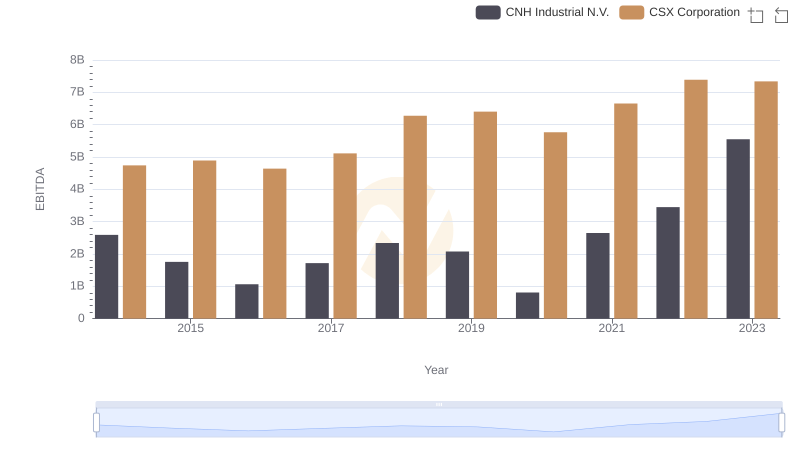
CSX Corporation and CNH Industrial N.V.: A Detailed Examination of EBITDA Performance