| __timestamp | CSX Corporation | Curtiss-Wright Corporation |
|---|---|---|
| Wednesday, January 1, 2014 | 4740000000 | 401669000 |
| Thursday, January 1, 2015 | 4890000000 | 412042000 |
| Friday, January 1, 2016 | 4640000000 | 405217000 |
| Sunday, January 1, 2017 | 5113000000 | 441085000 |
| Monday, January 1, 2018 | 6274000000 | 493171000 |
| Tuesday, January 1, 2019 | 6402000000 | 530221000 |
| Wednesday, January 1, 2020 | 5764000000 | 414499000 |
| Friday, January 1, 2021 | 6653000000 | 509134000 |
| Saturday, January 1, 2022 | 7390000000 | 548202000 |
| Sunday, January 1, 2023 | 7340000000 | 630635000 |
| Monday, January 1, 2024 | 674592000 |
In pursuit of knowledge
In the ever-evolving landscape of American industry, CSX Corporation and Curtiss-Wright Corporation stand as titans in their respective fields. Over the past decade, from 2014 to 2023, these companies have demonstrated remarkable resilience and growth in their EBITDA performance. CSX Corporation, a leader in rail transportation, has seen its EBITDA grow by approximately 55%, peaking in 2022 with a 7.39 billion USD mark. This growth reflects the company's strategic investments and operational efficiencies.
On the other hand, Curtiss-Wright Corporation, a key player in the aerospace and defense sector, has experienced a steady EBITDA increase of around 57% over the same period, reaching its highest point in 2023. This growth underscores the company's innovation and adaptability in a competitive market. The data reveals a compelling narrative of industrial growth and strategic prowess, offering valuable insights for investors and industry enthusiasts alike.
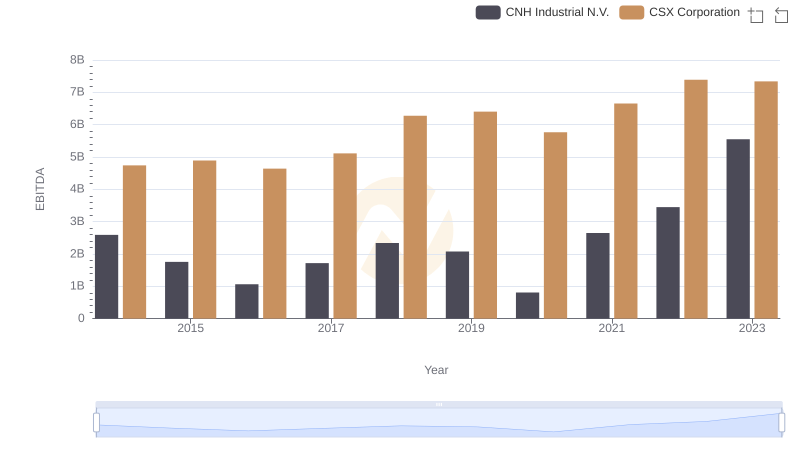
CSX Corporation and CNH Industrial N.V.: A Detailed Examination of EBITDA Performance
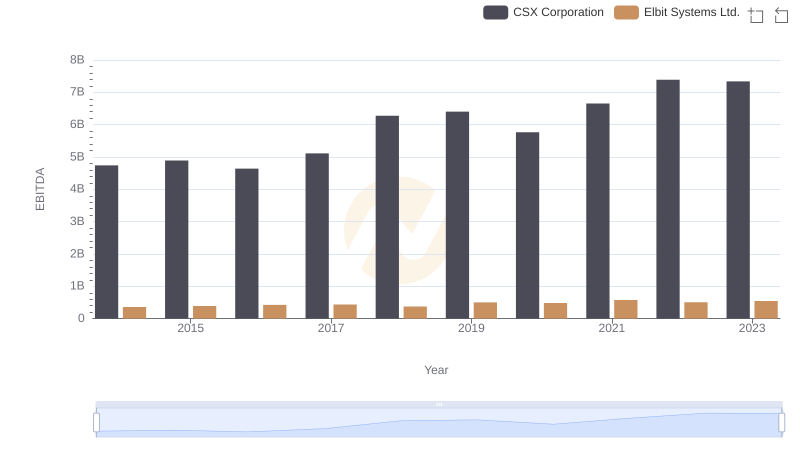
CSX Corporation vs Elbit Systems Ltd.: In-Depth EBITDA Performance Comparison
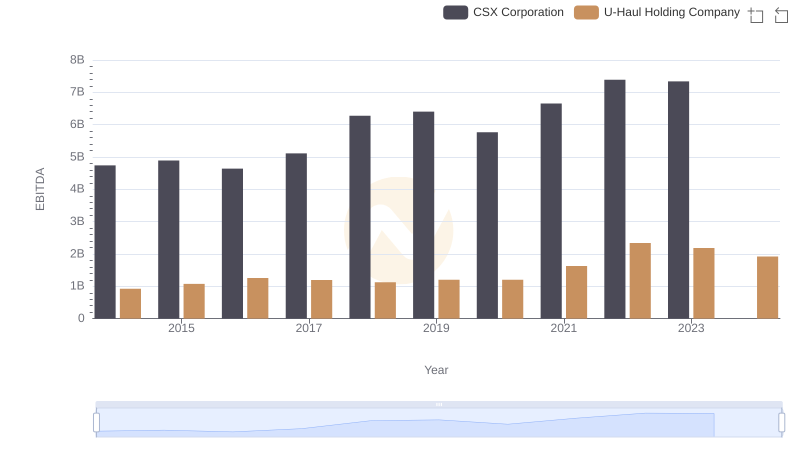
CSX Corporation vs U-Haul Holding Company: In-Depth EBITDA Performance Comparison
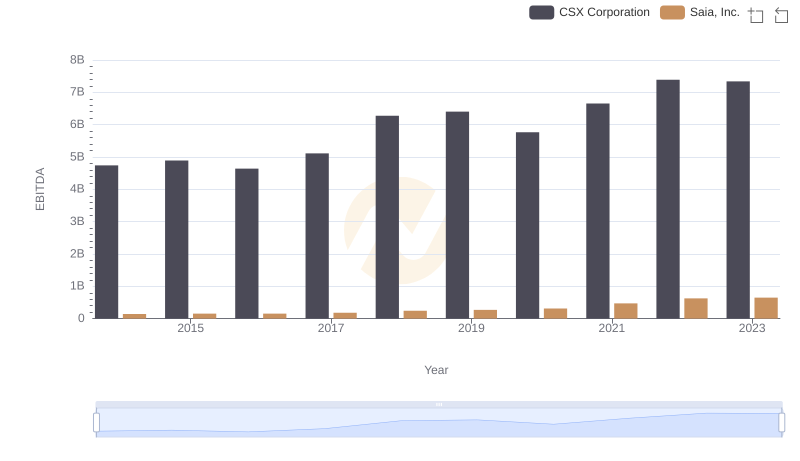
EBITDA Performance Review: CSX Corporation vs Saia, Inc.
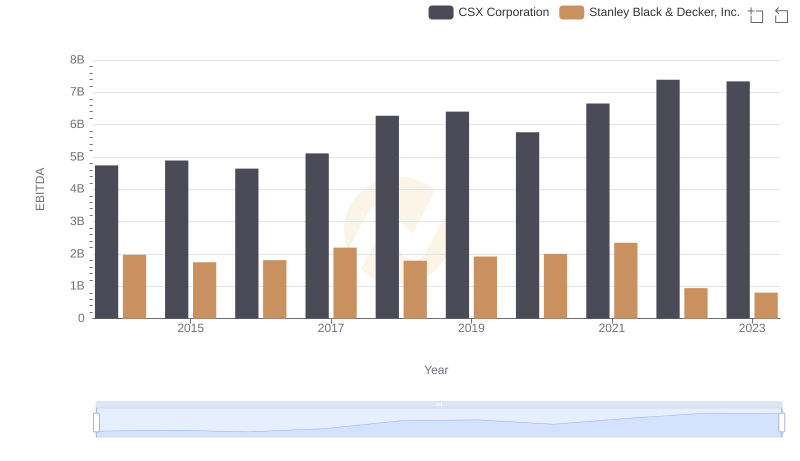
A Professional Review of EBITDA: CSX Corporation Compared to Stanley Black & Decker, Inc.
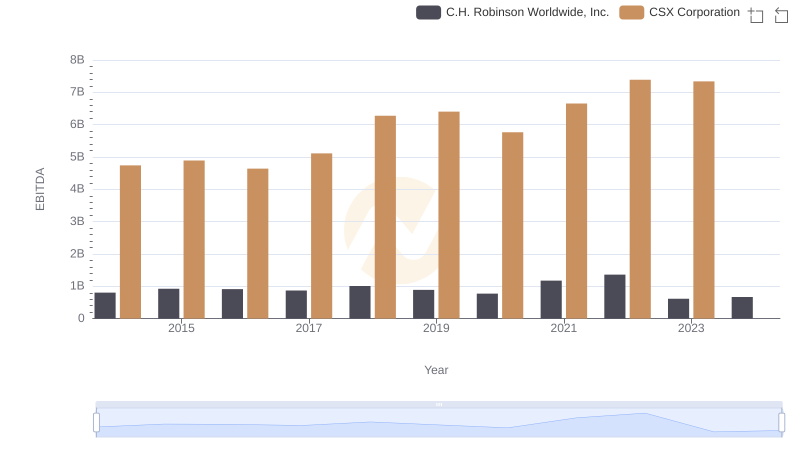
A Professional Review of EBITDA: CSX Corporation Compared to C.H. Robinson Worldwide, Inc.
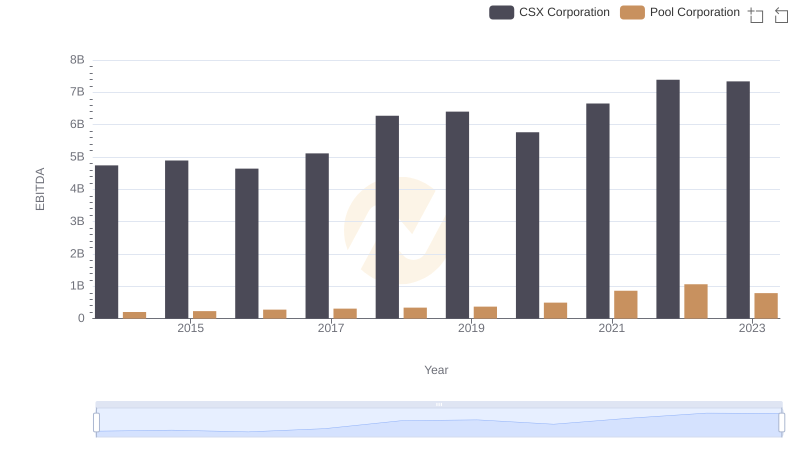
EBITDA Performance Review: CSX Corporation vs Pool Corporation
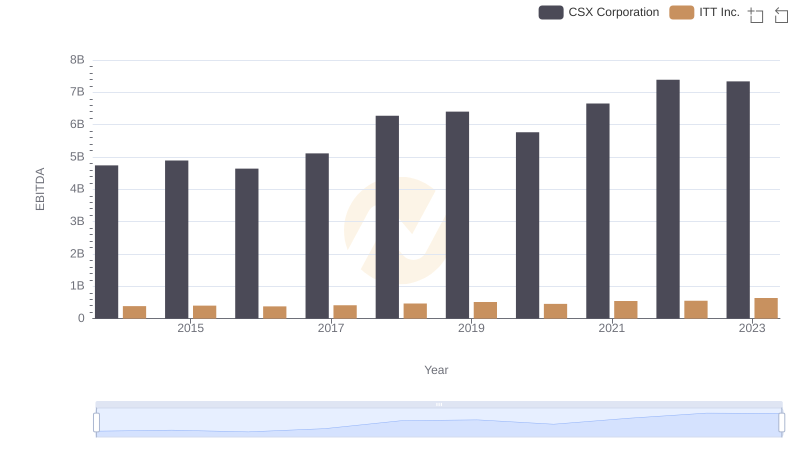
CSX Corporation and ITT Inc.: A Detailed Examination of EBITDA Performance