| __timestamp | Nordson Corporation | Waste Connections, Inc. |
|---|---|---|
| Wednesday, January 1, 2014 | 427302000 | 717805000 |
| Thursday, January 1, 2015 | 384160000 | 191002871 |
| Friday, January 1, 2016 | 460120000 | 900371894 |
| Sunday, January 1, 2017 | 547746000 | 1380632000 |
| Monday, January 1, 2018 | 606502000 | 1442229014 |
| Tuesday, January 1, 2019 | 588493000 | 1650754605 |
| Wednesday, January 1, 2020 | 446951000 | 1597555000 |
| Friday, January 1, 2021 | 703550000 | 1891001000 |
| Saturday, January 1, 2022 | 771615000 | 2090554149 |
| Sunday, January 1, 2023 | 786742000 | 2261354000 |
| Monday, January 1, 2024 | 674001000 | 2389779000 |
Unlocking the unknown
In the ever-evolving landscape of industrial giants, Waste Connections, Inc. and Nordson Corporation have showcased remarkable EBITDA growth over the past decade. From 2014 to 2023, Waste Connections, Inc. has consistently outperformed Nordson Corporation, with its EBITDA growing by approximately 215%, peaking in 2023. In contrast, Nordson Corporation experienced a more modest growth of around 84% during the same period.
This comparison highlights the dynamic nature of these companies' financial health, offering valuable insights for investors and industry analysts alike.
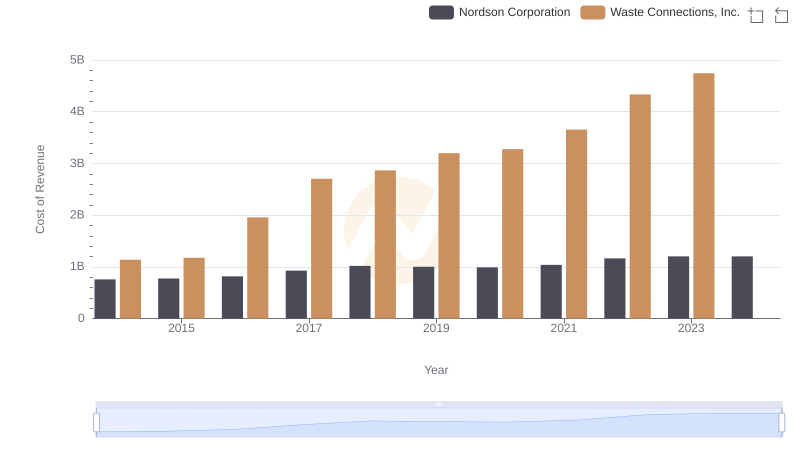
Cost of Revenue Trends: Waste Connections, Inc. vs Nordson Corporation
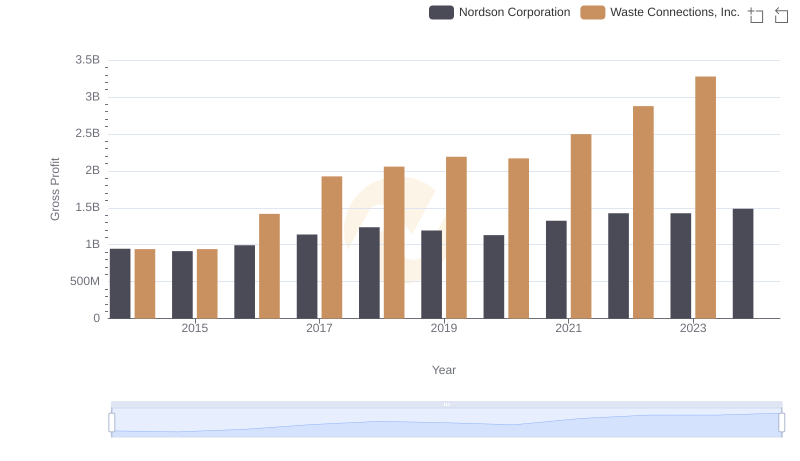
Gross Profit Comparison: Waste Connections, Inc. and Nordson Corporation Trends
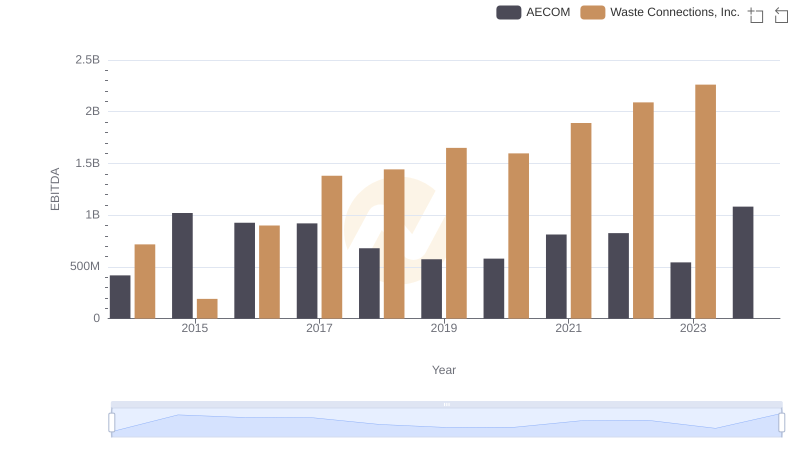
Professional EBITDA Benchmarking: Waste Connections, Inc. vs AECOM
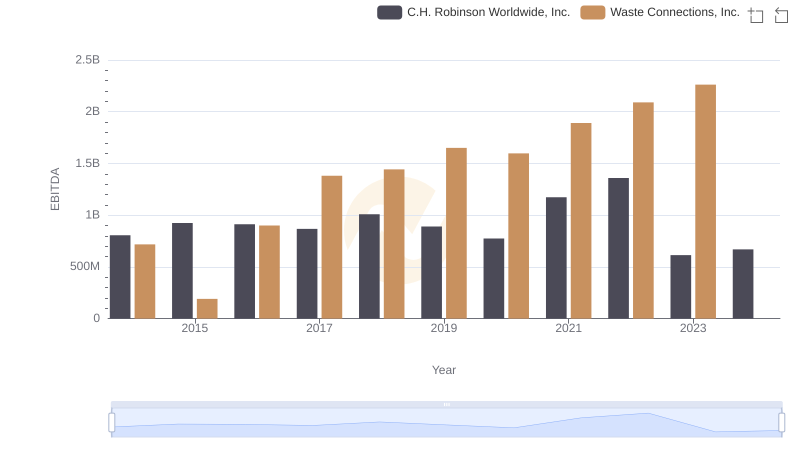
A Professional Review of EBITDA: Waste Connections, Inc. Compared to C.H. Robinson Worldwide, Inc.
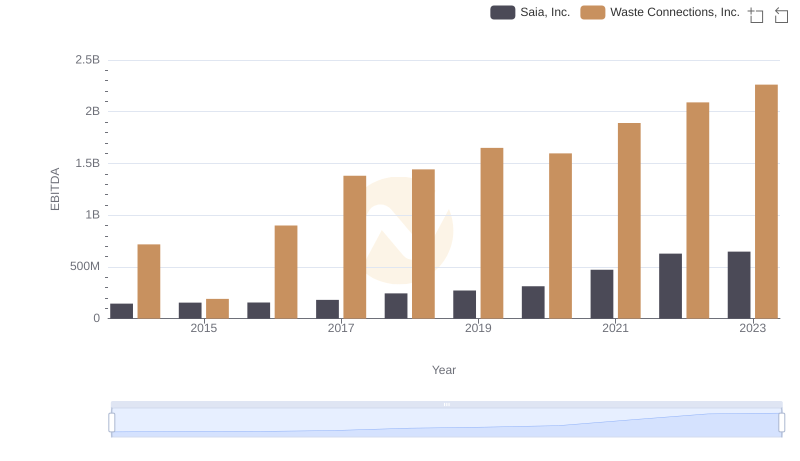
EBITDA Performance Review: Waste Connections, Inc. vs Saia, Inc.
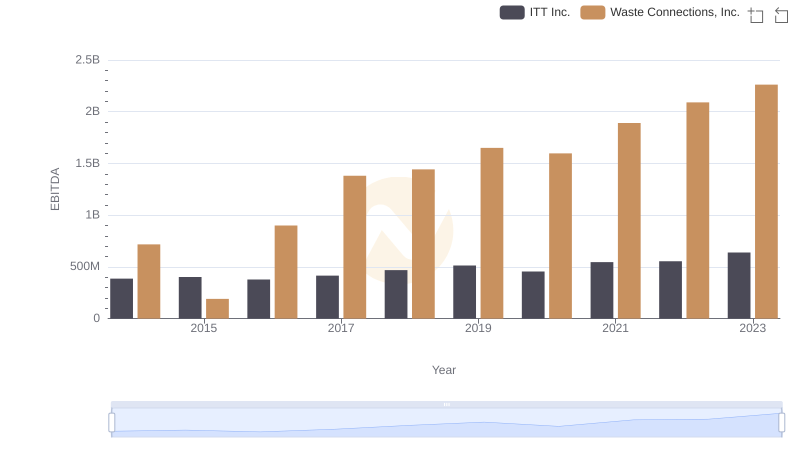
Comprehensive EBITDA Comparison: Waste Connections, Inc. vs ITT Inc.