| __timestamp | Nordson Corporation | Waste Connections, Inc. |
|---|---|---|
| Wednesday, January 1, 2014 | 945098000 | 940778000 |
| Thursday, January 1, 2015 | 913964000 | 939878000 |
| Friday, January 1, 2016 | 993499000 | 1418151000 |
| Sunday, January 1, 2017 | 1139001000 | 1925713000 |
| Monday, January 1, 2018 | 1235965000 | 2057237000 |
| Tuesday, January 1, 2019 | 1192103000 | 2189922000 |
| Wednesday, January 1, 2020 | 1130468000 | 2169182000 |
| Friday, January 1, 2021 | 1324080000 | 2497287000 |
| Saturday, January 1, 2022 | 1426536000 | 2875847000 |
| Sunday, January 1, 2023 | 1425405000 | 3277438000 |
| Monday, January 1, 2024 | 1486129000 | 3727885000 |
Infusing magic into the data realm
In the ever-evolving landscape of industrial growth, Waste Connections, Inc. and Nordson Corporation have emerged as formidable players. Over the past decade, Waste Connections has seen its gross profit soar by approximately 248%, from 2014 to 2023, showcasing its robust expansion in the waste management sector. Meanwhile, Nordson Corporation, a leader in precision technology, has experienced a steady increase of around 57% in the same period.
The year 2023 marked a significant milestone for Waste Connections, with its gross profit peaking at over 3.2 billion, a testament to its strategic acquisitions and operational efficiencies. Nordson, while not reaching the same heights, maintained a consistent upward trajectory, reflecting its resilience and innovation in a competitive market.
As we look to the future, these trends highlight the dynamic nature of industrial growth and the potential for continued success in these sectors.
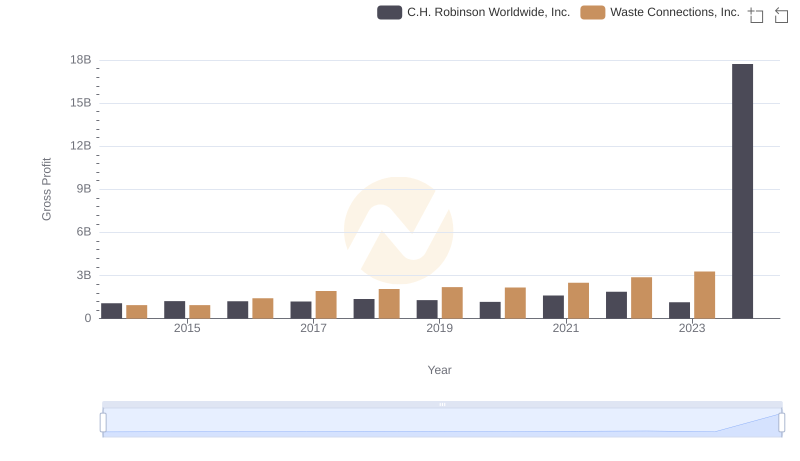
Key Insights on Gross Profit: Waste Connections, Inc. vs C.H. Robinson Worldwide, Inc.
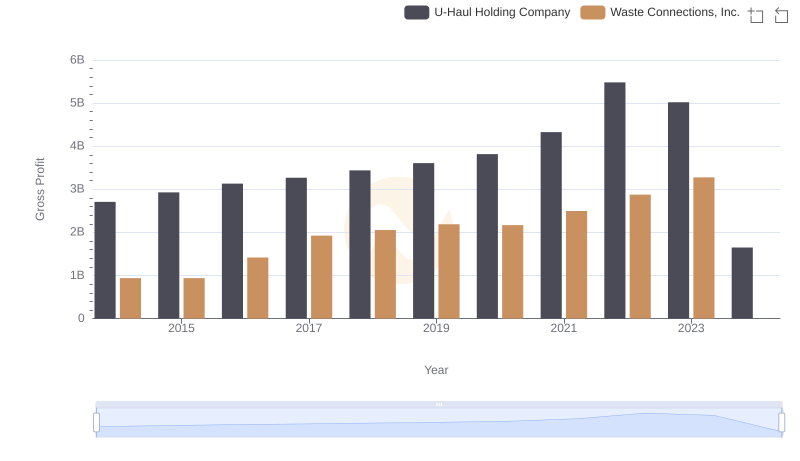
Key Insights on Gross Profit: Waste Connections, Inc. vs U-Haul Holding Company
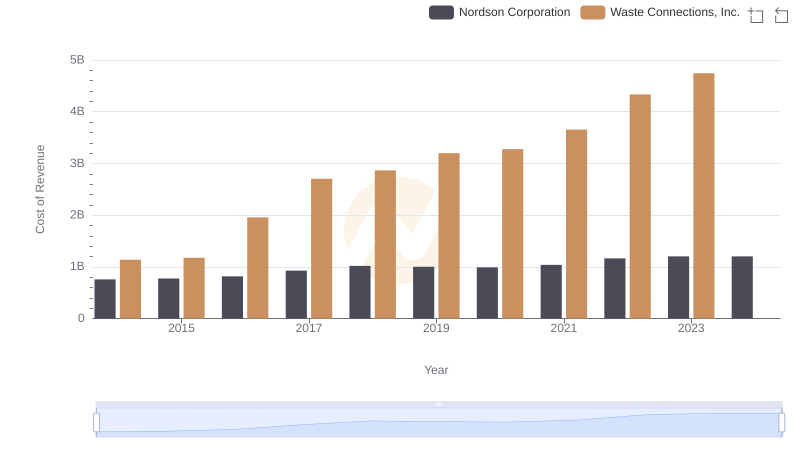
Cost of Revenue Trends: Waste Connections, Inc. vs Nordson Corporation
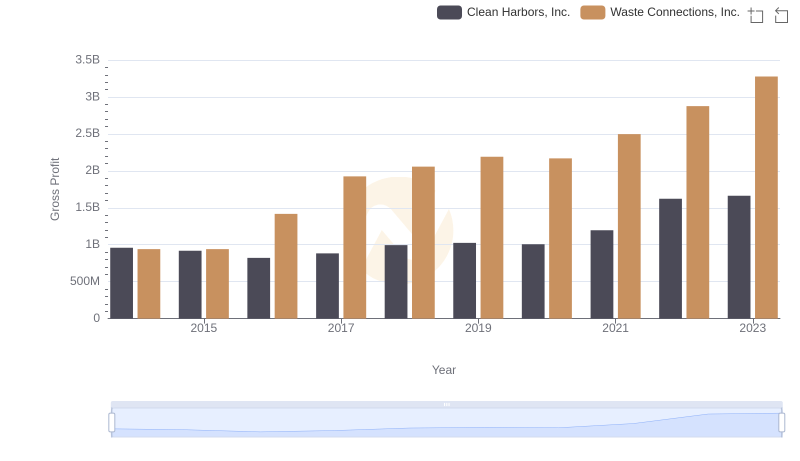
Waste Connections, Inc. and Clean Harbors, Inc.: A Detailed Gross Profit Analysis
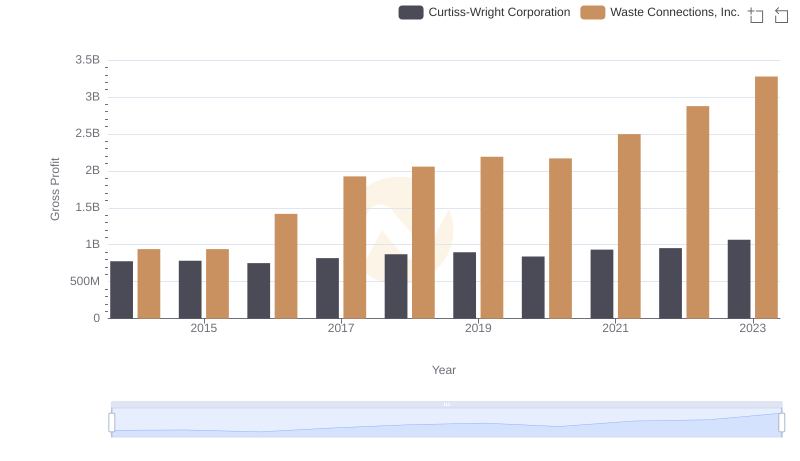
Gross Profit Trends Compared: Waste Connections, Inc. vs Curtiss-Wright Corporation
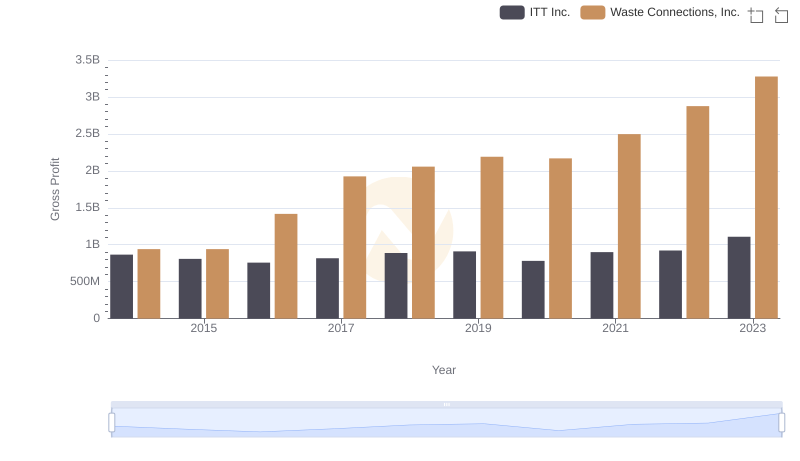
Waste Connections, Inc. vs ITT Inc.: A Gross Profit Performance Breakdown
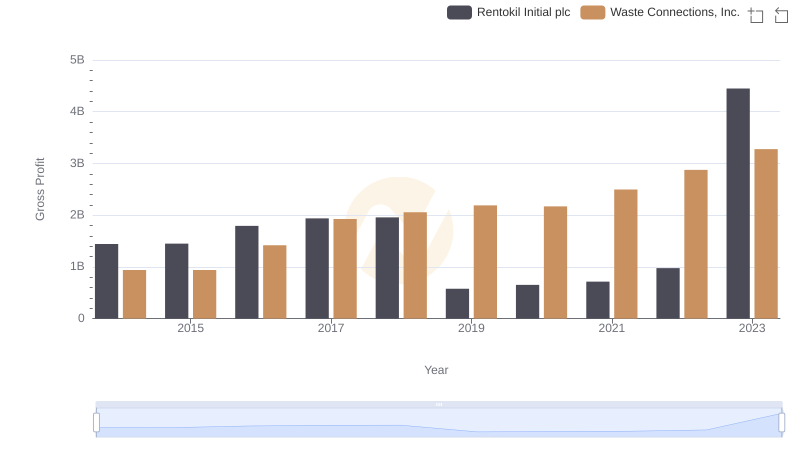
Gross Profit Analysis: Comparing Waste Connections, Inc. and Rentokil Initial plc

Comprehensive EBITDA Comparison: Waste Connections, Inc. vs Nordson Corporation