| __timestamp | Hubbell Incorporated | Waste Connections, Inc. |
|---|---|---|
| Wednesday, January 1, 2014 | 2250400000 | 1138388000 |
| Thursday, January 1, 2015 | 2298600000 | 1177409000 |
| Friday, January 1, 2016 | 2404500000 | 1957712000 |
| Sunday, January 1, 2017 | 2516900000 | 2704775000 |
| Monday, January 1, 2018 | 3181300000 | 2865704000 |
| Tuesday, January 1, 2019 | 3238300000 | 3198757000 |
| Wednesday, January 1, 2020 | 2976700000 | 3276808000 |
| Friday, January 1, 2021 | 3042600000 | 3654074000 |
| Saturday, January 1, 2022 | 3476300000 | 4336012000 |
| Sunday, January 1, 2023 | 3484800000 | 4744513000 |
| Monday, January 1, 2024 | 3724400000 | 5191706000 |
Data in motion
In the ever-evolving landscape of industrial operations, understanding cost dynamics is crucial. Waste Connections, Inc. and Hubbell Incorporated, two giants in their respective fields, have shown intriguing trends in their cost of revenue over the past decade. From 2014 to 2023, Waste Connections, Inc. has seen a remarkable increase of over 300% in its cost of revenue, reflecting its aggressive expansion and operational scaling. In contrast, Hubbell Incorporated's cost of revenue grew by approximately 55%, indicating a more stable growth trajectory.
These trends offer a window into the strategic priorities of these companies, with Waste Connections focusing on expansion and Hubbell on steady growth.
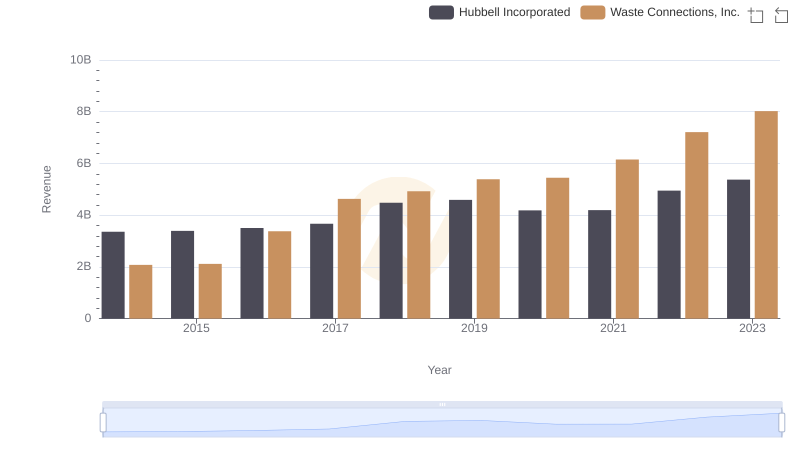
Annual Revenue Comparison: Waste Connections, Inc. vs Hubbell Incorporated
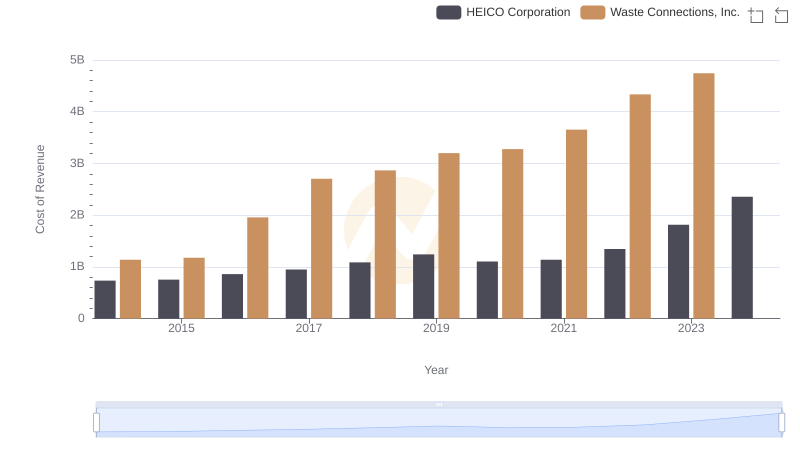
Comparing Cost of Revenue Efficiency: Waste Connections, Inc. vs HEICO Corporation
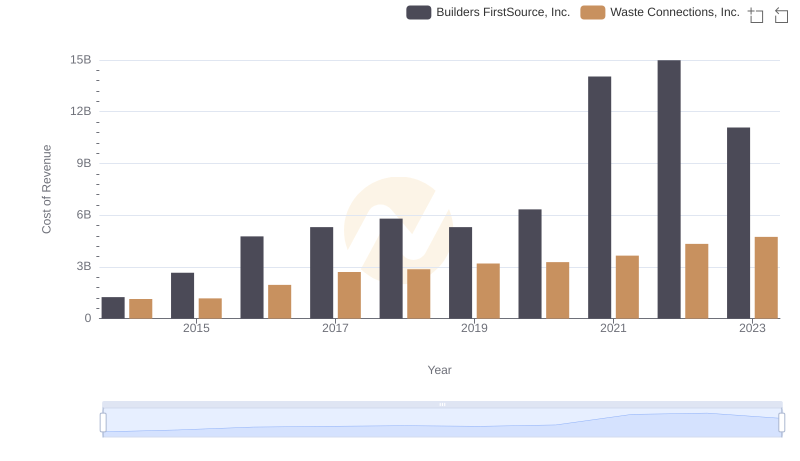
Comparing Cost of Revenue Efficiency: Waste Connections, Inc. vs Builders FirstSource, Inc.
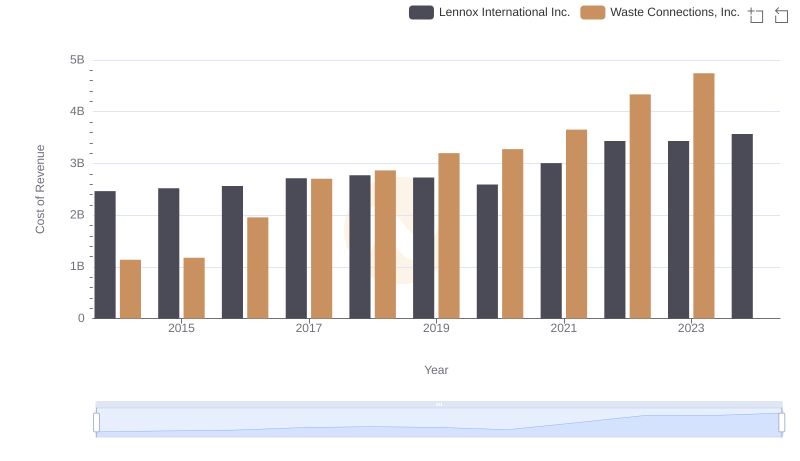
Waste Connections, Inc. vs Lennox International Inc.: Efficiency in Cost of Revenue Explored

Cost of Revenue: Key Insights for Waste Connections, Inc. and Ryanair Holdings plc
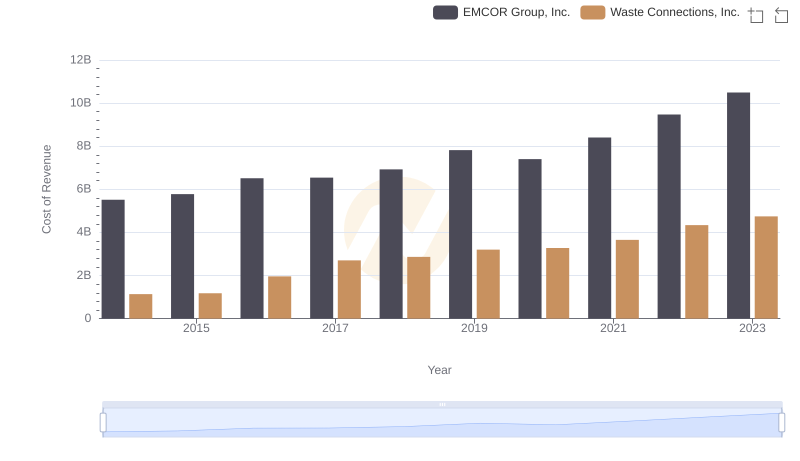
Cost of Revenue Comparison: Waste Connections, Inc. vs EMCOR Group, Inc.
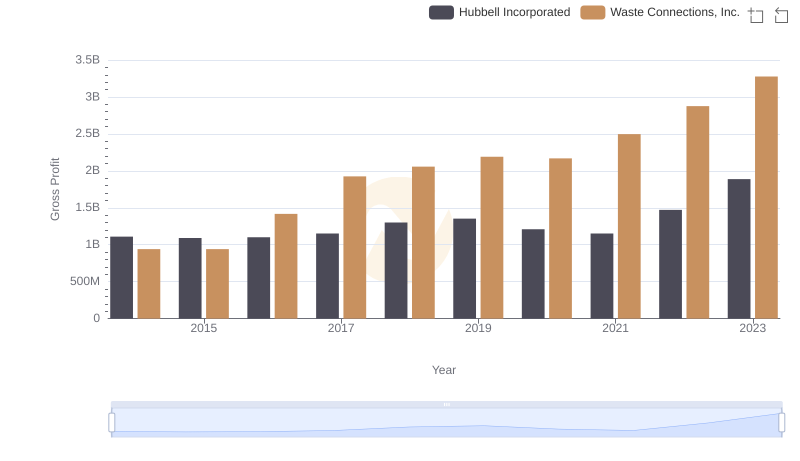
Waste Connections, Inc. and Hubbell Incorporated: A Detailed Gross Profit Analysis
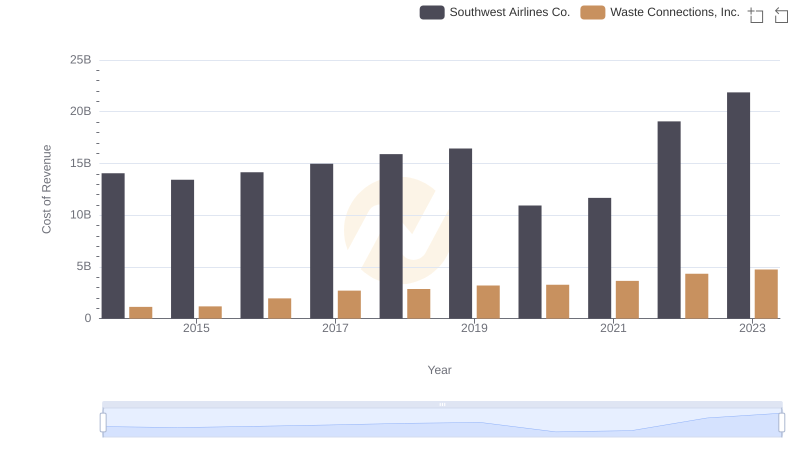
Cost of Revenue Comparison: Waste Connections, Inc. vs Southwest Airlines Co.
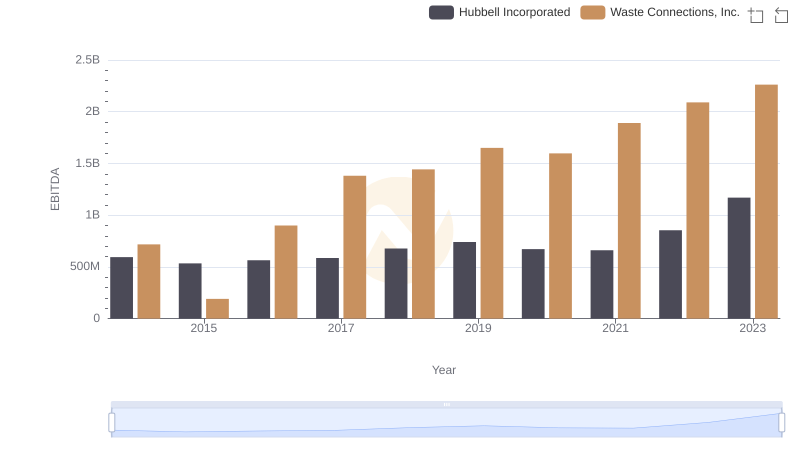
Waste Connections, Inc. vs Hubbell Incorporated: In-Depth EBITDA Performance Comparison