| __timestamp | Hubbell Incorporated | Waste Connections, Inc. |
|---|---|---|
| Wednesday, January 1, 2014 | 594700000 | 717805000 |
| Thursday, January 1, 2015 | 533600000 | 191002871 |
| Friday, January 1, 2016 | 564700000 | 900371894 |
| Sunday, January 1, 2017 | 585600000 | 1380632000 |
| Monday, January 1, 2018 | 677500000 | 1442229014 |
| Tuesday, January 1, 2019 | 740900000 | 1650754605 |
| Wednesday, January 1, 2020 | 671400000 | 1597555000 |
| Friday, January 1, 2021 | 661000000 | 1891001000 |
| Saturday, January 1, 2022 | 854300000 | 2090554149 |
| Sunday, January 1, 2023 | 1169700000 | 2261354000 |
| Monday, January 1, 2024 | 1291200000 | 2389779000 |
Unleashing the power of data
In the ever-evolving landscape of corporate finance, EBITDA serves as a crucial indicator of a company's operational efficiency. Over the past decade, Waste Connections, Inc. and Hubbell Incorporated have demonstrated contrasting trajectories in their EBITDA performance.
From 2014 to 2023, Waste Connections, Inc. has seen a remarkable growth of over 215% in EBITDA, reflecting its strategic expansions and operational efficiencies. In contrast, Hubbell Incorporated, while experiencing a steady increase, has grown by approximately 97% during the same period.
The year 2023 marked a significant milestone, with Waste Connections, Inc. achieving an EBITDA nearly double that of Hubbell Incorporated. This divergence highlights the dynamic nature of the industry and the importance of strategic positioning. As we look to the future, these trends offer valuable insights into the competitive landscape and potential investment opportunities.
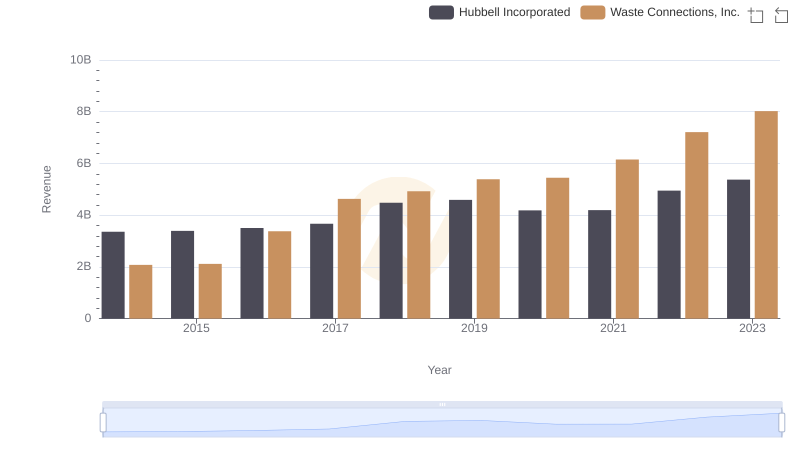
Annual Revenue Comparison: Waste Connections, Inc. vs Hubbell Incorporated
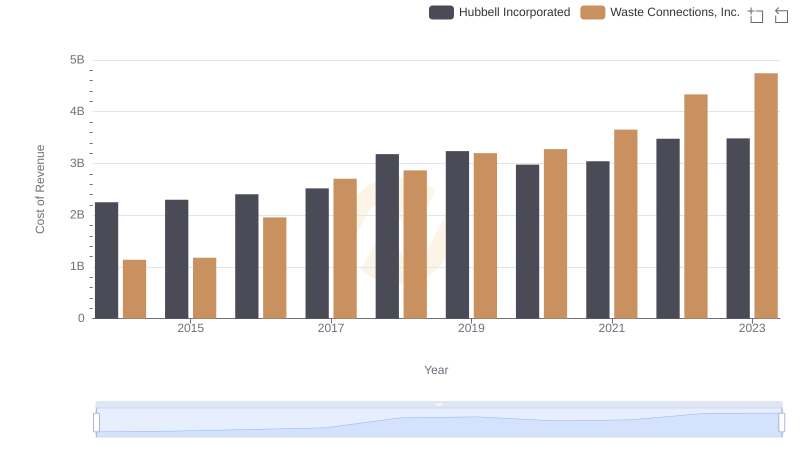
Cost of Revenue Trends: Waste Connections, Inc. vs Hubbell Incorporated
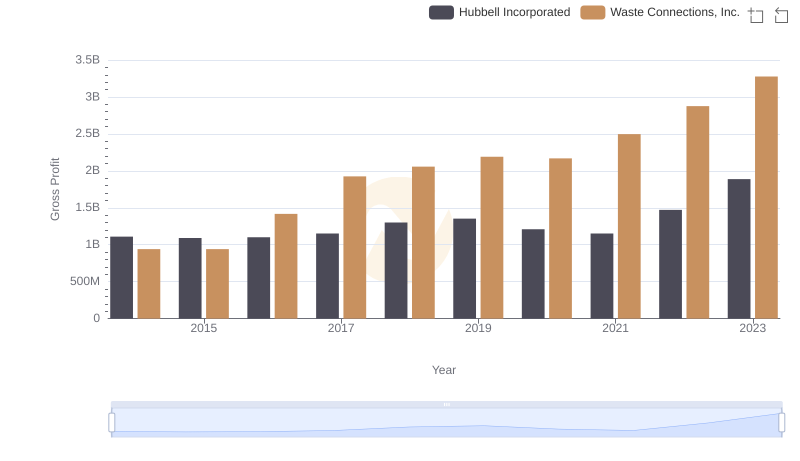
Waste Connections, Inc. and Hubbell Incorporated: A Detailed Gross Profit Analysis
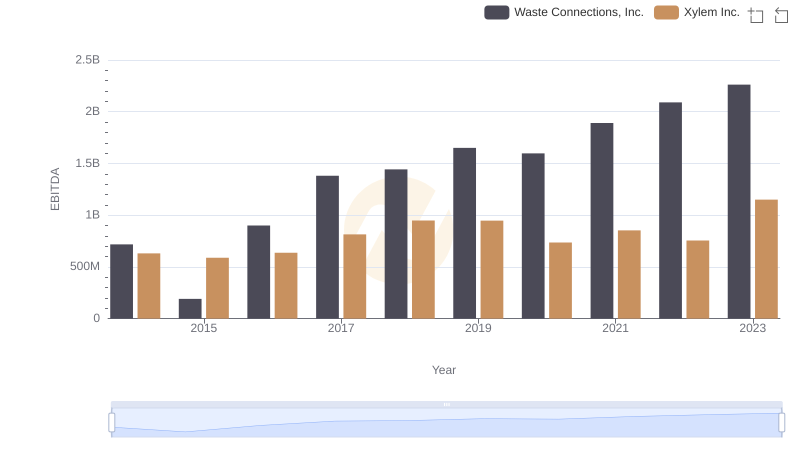
Comprehensive EBITDA Comparison: Waste Connections, Inc. vs Xylem Inc.
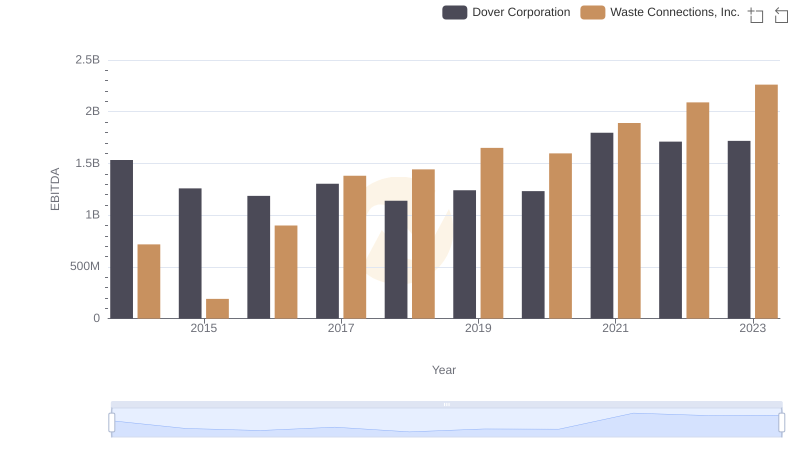
EBITDA Analysis: Evaluating Waste Connections, Inc. Against Dover Corporation
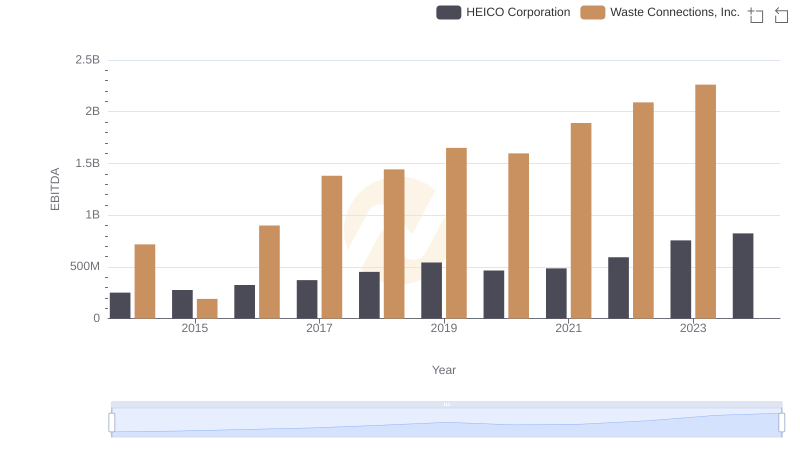
EBITDA Performance Review: Waste Connections, Inc. vs HEICO Corporation
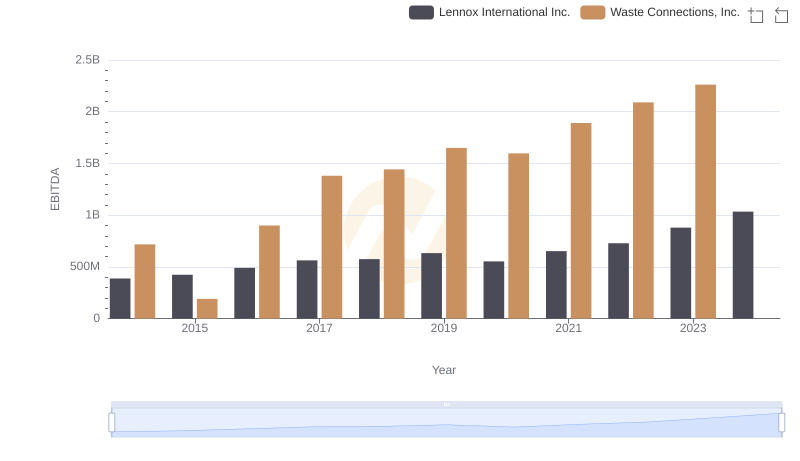
A Side-by-Side Analysis of EBITDA: Waste Connections, Inc. and Lennox International Inc.
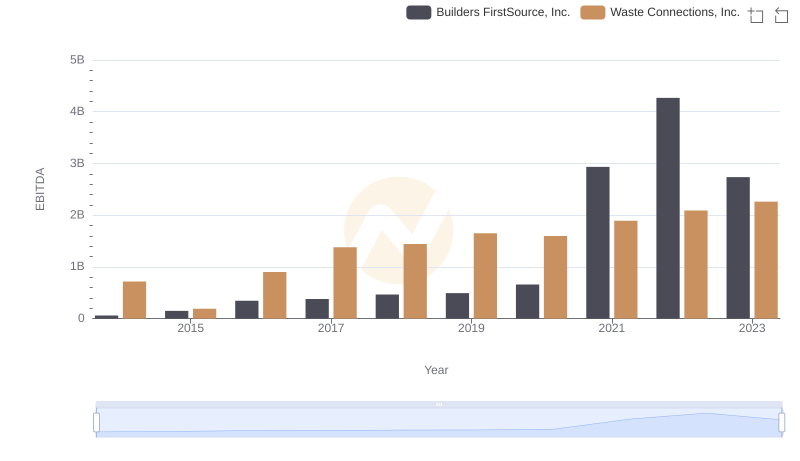
Waste Connections, Inc. vs Builders FirstSource, Inc.: In-Depth EBITDA Performance Comparison
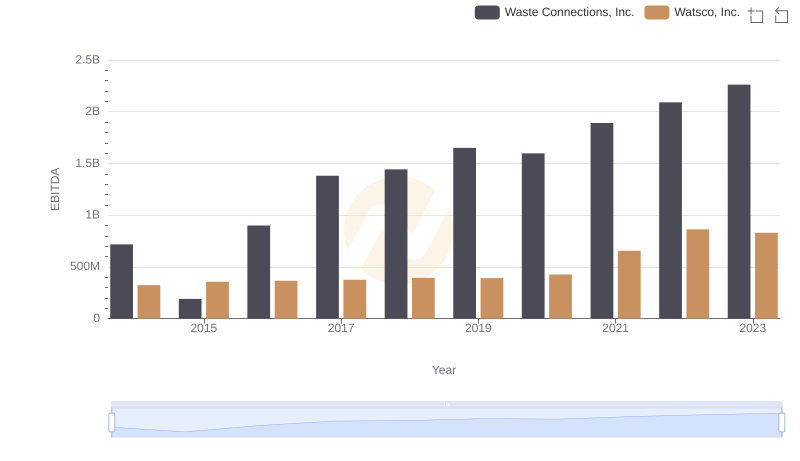
EBITDA Analysis: Evaluating Waste Connections, Inc. Against Watsco, Inc.