| __timestamp | Builders FirstSource, Inc. | Waste Connections, Inc. |
|---|---|---|
| Wednesday, January 1, 2014 | 1247099000 | 1138388000 |
| Thursday, January 1, 2015 | 2662967000 | 1177409000 |
| Friday, January 1, 2016 | 4770536000 | 1957712000 |
| Sunday, January 1, 2017 | 5306818000 | 2704775000 |
| Monday, January 1, 2018 | 5801831000 | 2865704000 |
| Tuesday, January 1, 2019 | 5303602000 | 3198757000 |
| Wednesday, January 1, 2020 | 6336290000 | 3276808000 |
| Friday, January 1, 2021 | 14042900000 | 3654074000 |
| Saturday, January 1, 2022 | 14982039000 | 4336012000 |
| Sunday, January 1, 2023 | 11084996000 | 4744513000 |
| Monday, January 1, 2024 | 5191706000 |
Data in motion
In the ever-evolving landscape of American industry, Waste Connections, Inc. and Builders FirstSource, Inc. stand as exemplars of cost efficiency. Over the past decade, Builders FirstSource has demonstrated a remarkable growth trajectory, with its cost of revenue surging by over 780% from 2014 to 2023. This reflects the company's strategic expansion and operational efficiency in the construction materials sector. Meanwhile, Waste Connections, a leader in waste management, has seen a steady increase of approximately 317% in the same period, underscoring its consistent performance in a stable industry.
The data reveals a fascinating contrast: while Builders FirstSource experienced a peak in 2022, Waste Connections maintained a more gradual ascent, reaching its highest cost of revenue in 2023. This comparison not only highlights the dynamic nature of these industries but also offers insights into their strategic priorities and market conditions.
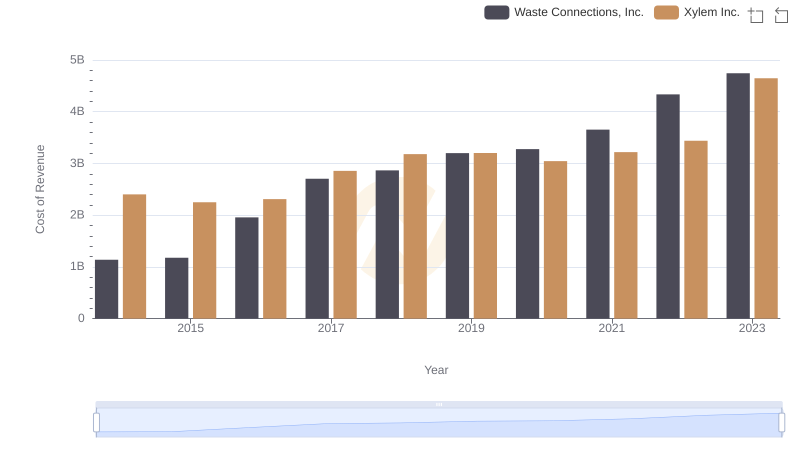
Cost of Revenue: Key Insights for Waste Connections, Inc. and Xylem Inc.
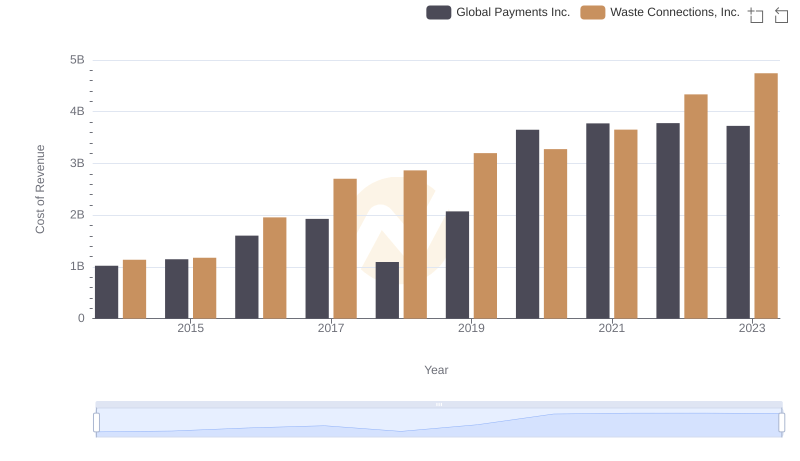
Cost Insights: Breaking Down Waste Connections, Inc. and Global Payments Inc.'s Expenses
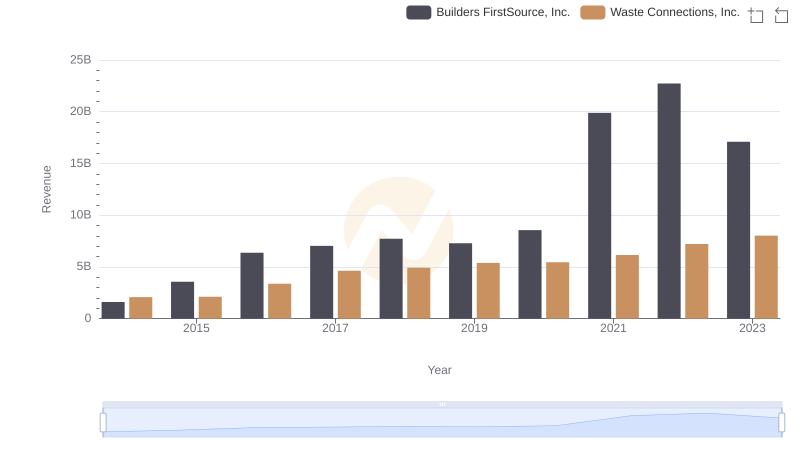
Who Generates More Revenue? Waste Connections, Inc. or Builders FirstSource, Inc.
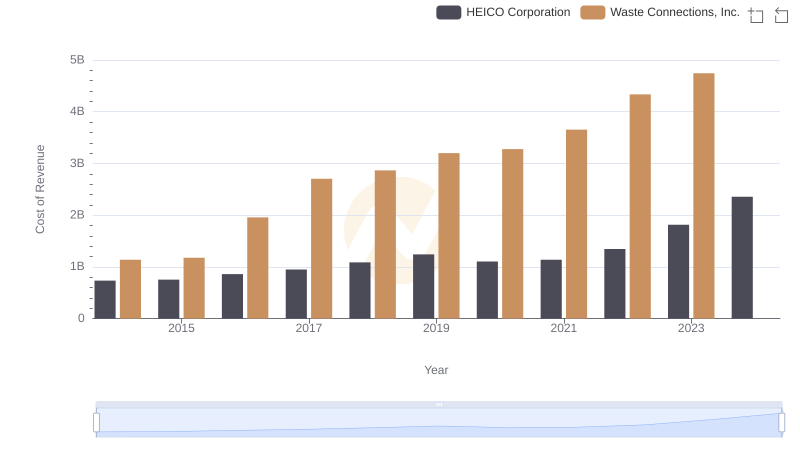
Comparing Cost of Revenue Efficiency: Waste Connections, Inc. vs HEICO Corporation
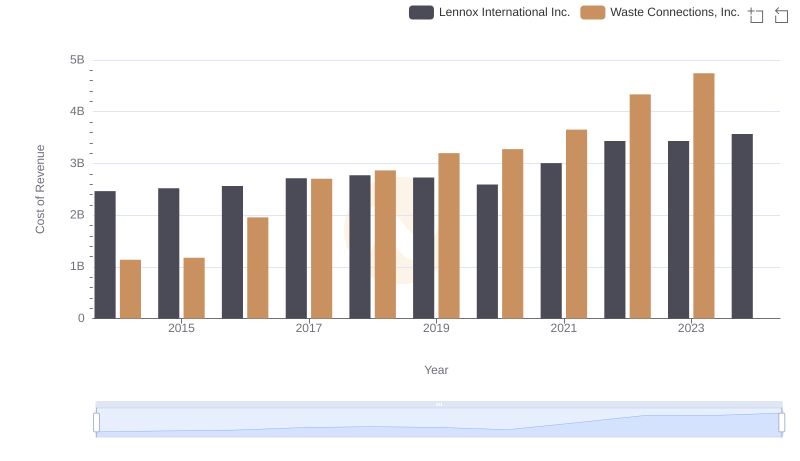
Waste Connections, Inc. vs Lennox International Inc.: Efficiency in Cost of Revenue Explored

Cost of Revenue: Key Insights for Waste Connections, Inc. and Ryanair Holdings plc
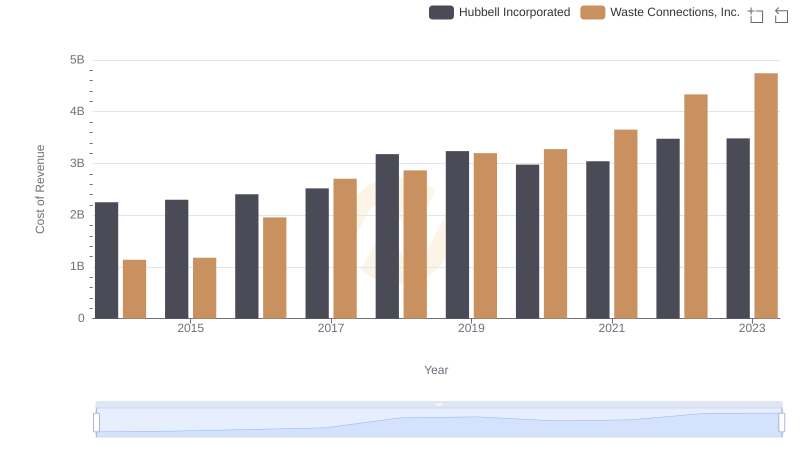
Cost of Revenue Trends: Waste Connections, Inc. vs Hubbell Incorporated
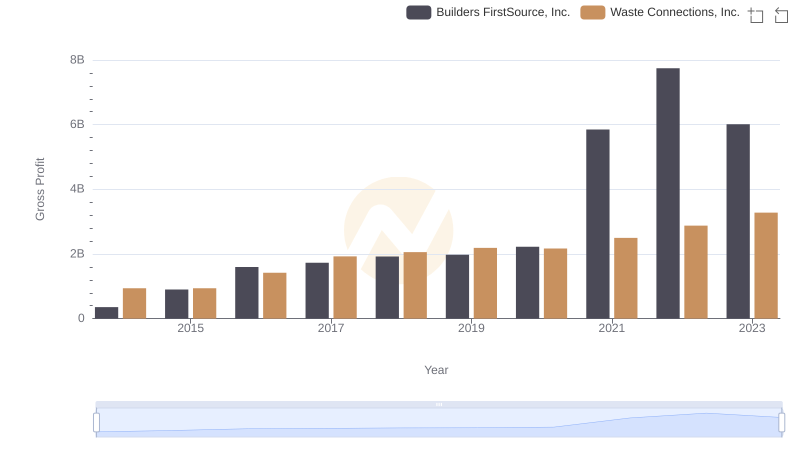
Key Insights on Gross Profit: Waste Connections, Inc. vs Builders FirstSource, Inc.
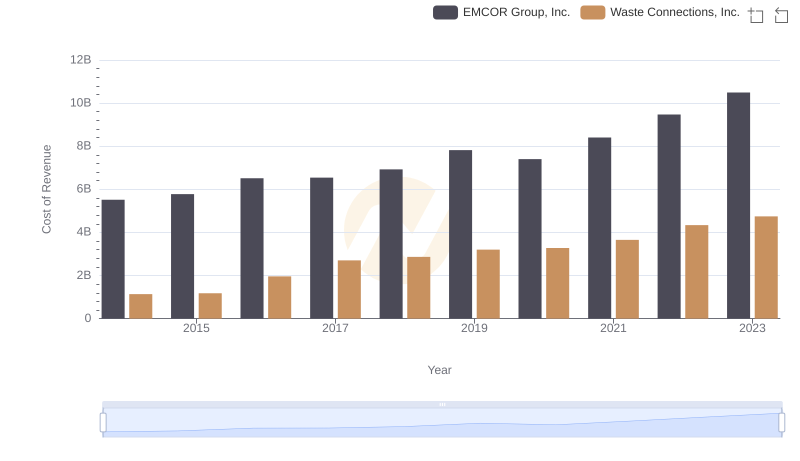
Cost of Revenue Comparison: Waste Connections, Inc. vs EMCOR Group, Inc.
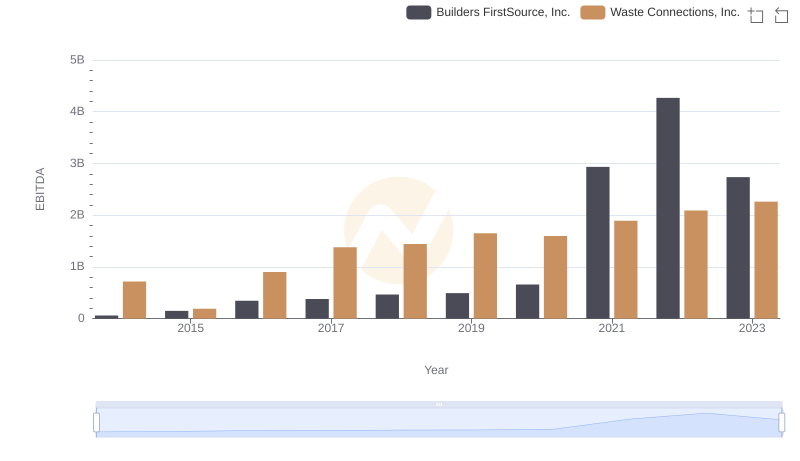
Waste Connections, Inc. vs Builders FirstSource, Inc.: In-Depth EBITDA Performance Comparison