| __timestamp | Hubbell Incorporated | Waste Connections, Inc. |
|---|---|---|
| Wednesday, January 1, 2014 | 1109000000 | 940778000 |
| Thursday, January 1, 2015 | 1091800000 | 939878000 |
| Friday, January 1, 2016 | 1100700000 | 1418151000 |
| Sunday, January 1, 2017 | 1151900000 | 1925713000 |
| Monday, January 1, 2018 | 1300400000 | 2057237000 |
| Tuesday, January 1, 2019 | 1352700000 | 2189922000 |
| Wednesday, January 1, 2020 | 1209300000 | 2169182000 |
| Friday, January 1, 2021 | 1151500000 | 2497287000 |
| Saturday, January 1, 2022 | 1471600000 | 2875847000 |
| Sunday, January 1, 2023 | 1888100000 | 3277438000 |
| Monday, January 1, 2024 | 1904100000 | 3727885000 |
Unlocking the unknown
In the ever-evolving landscape of corporate finance, understanding the trajectory of gross profits is crucial for investors and stakeholders. This analysis delves into the annual gross profit trends of two industry giants: Waste Connections, Inc. and Hubbell Incorporated, from 2014 to 2023.
Waste Connections, Inc. has demonstrated a robust growth trajectory, with its gross profit surging by approximately 248% over the decade. Notably, the company experienced a significant leap in 2023, reaching a peak gross profit of $3.28 billion, a testament to its strategic expansions and operational efficiencies.
Conversely, Hubbell Incorporated, while maintaining steady growth, saw a more modest increase of around 70% in the same period. The company's gross profit peaked at $1.89 billion in 2023, reflecting its consistent market presence and innovation-driven strategies.
This comparative analysis underscores the dynamic nature of these companies' financial health, offering valuable insights for potential investors.
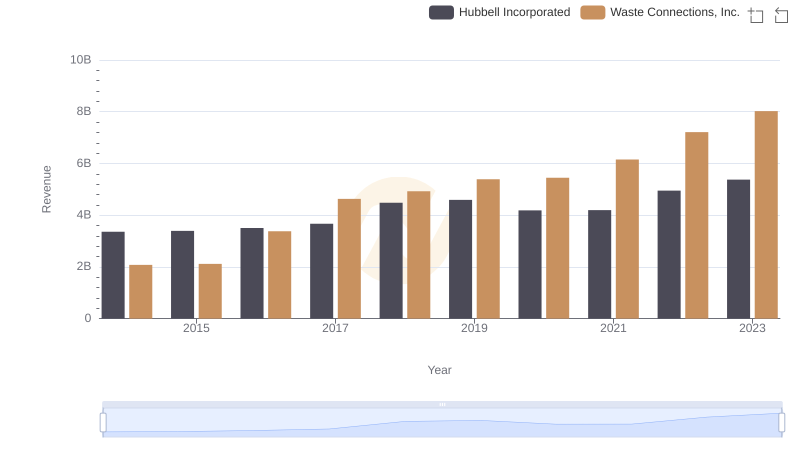
Annual Revenue Comparison: Waste Connections, Inc. vs Hubbell Incorporated
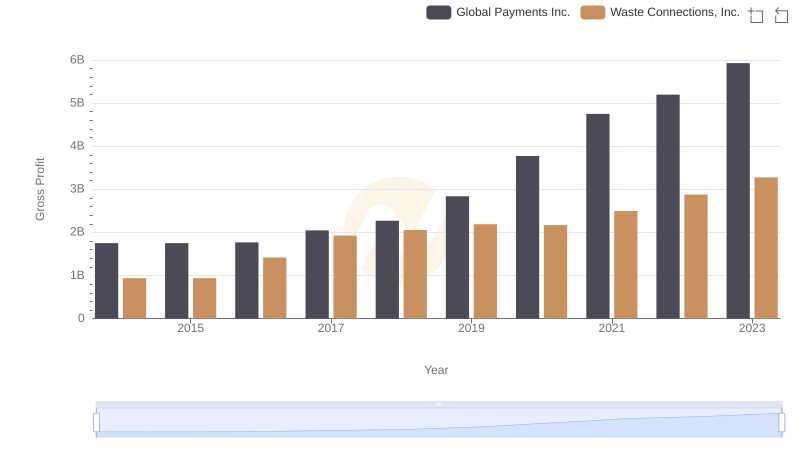
Gross Profit Trends Compared: Waste Connections, Inc. vs Global Payments Inc.
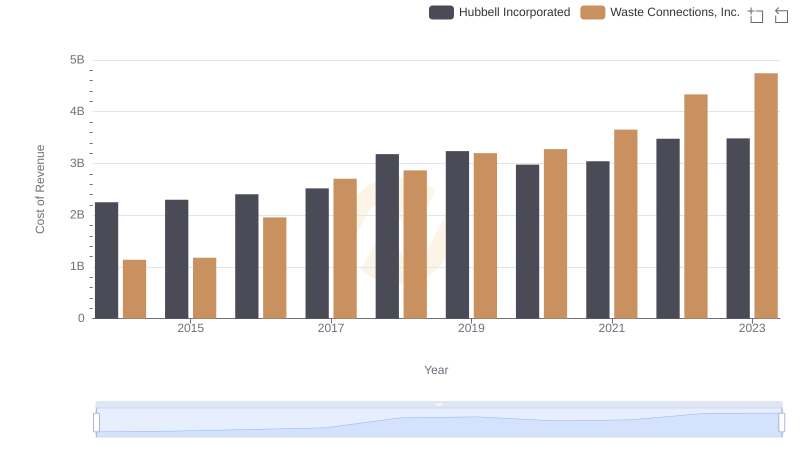
Cost of Revenue Trends: Waste Connections, Inc. vs Hubbell Incorporated
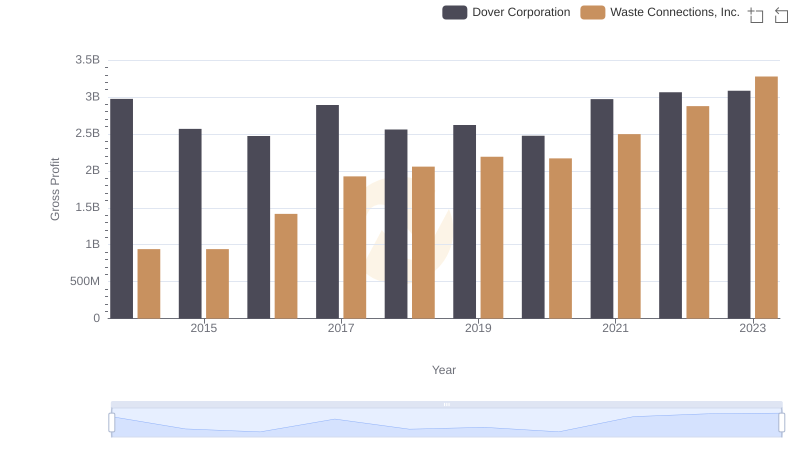
Waste Connections, Inc. and Dover Corporation: A Detailed Gross Profit Analysis
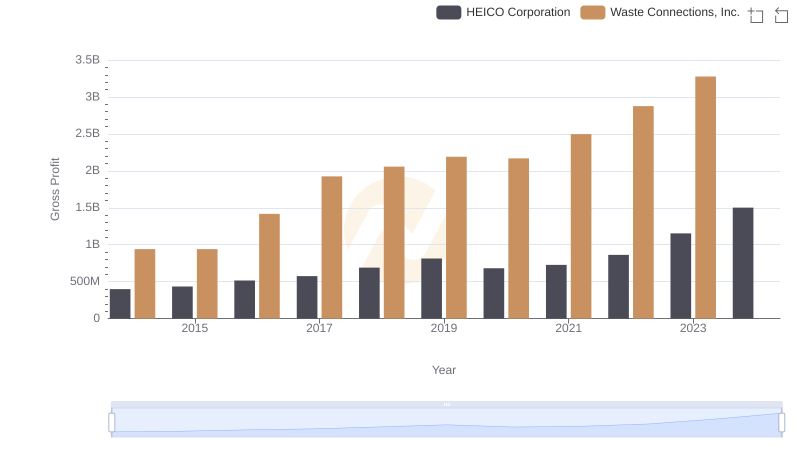
Gross Profit Analysis: Comparing Waste Connections, Inc. and HEICO Corporation
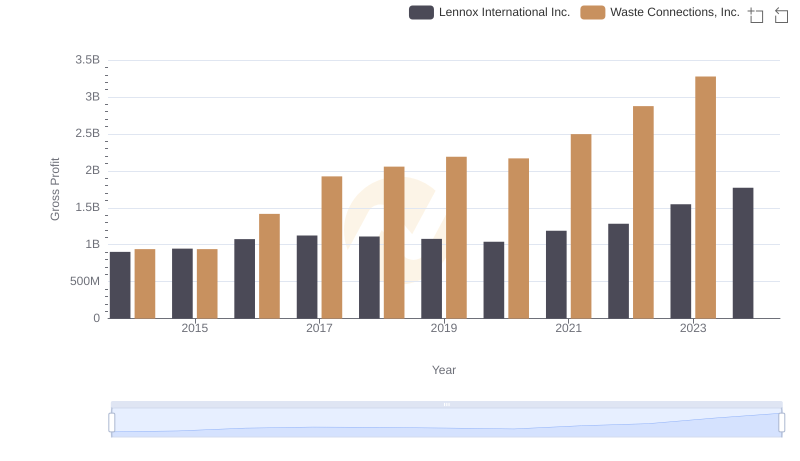
Who Generates Higher Gross Profit? Waste Connections, Inc. or Lennox International Inc.
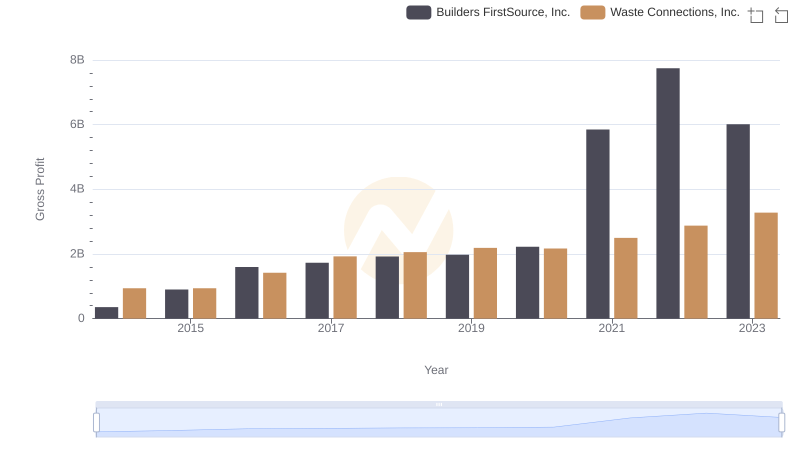
Key Insights on Gross Profit: Waste Connections, Inc. vs Builders FirstSource, Inc.
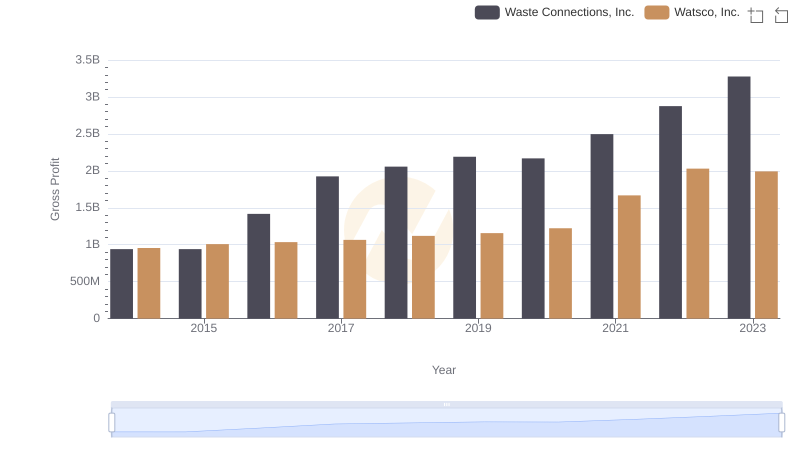
Gross Profit Comparison: Waste Connections, Inc. and Watsco, Inc. Trends
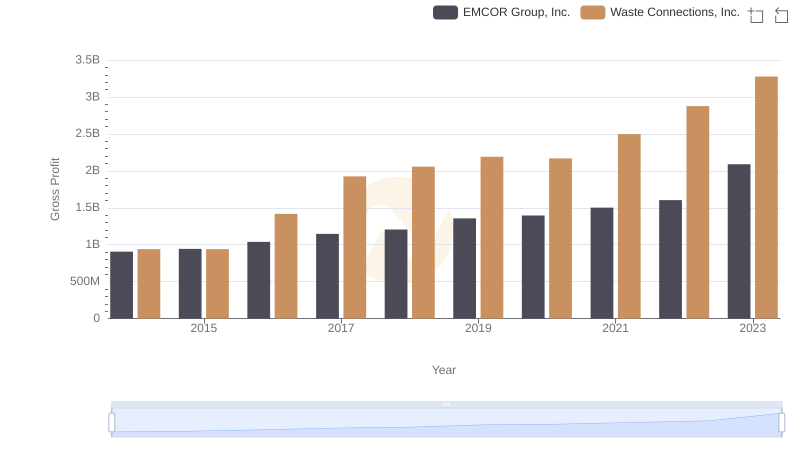
Gross Profit Trends Compared: Waste Connections, Inc. vs EMCOR Group, Inc.
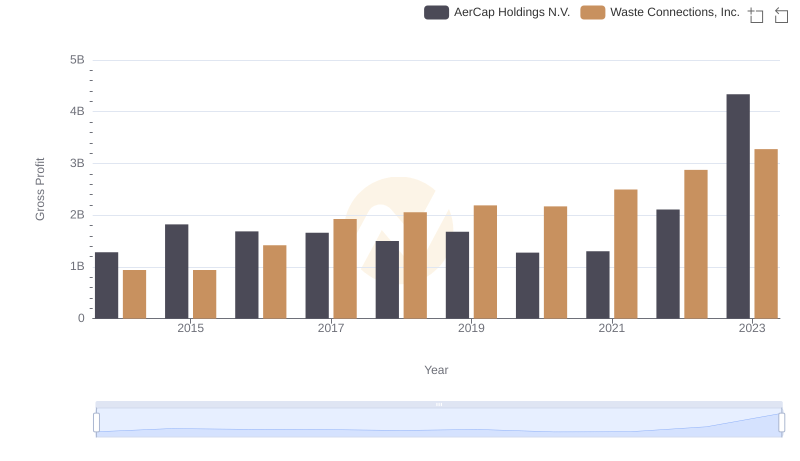
Who Generates Higher Gross Profit? Waste Connections, Inc. or AerCap Holdings N.V.
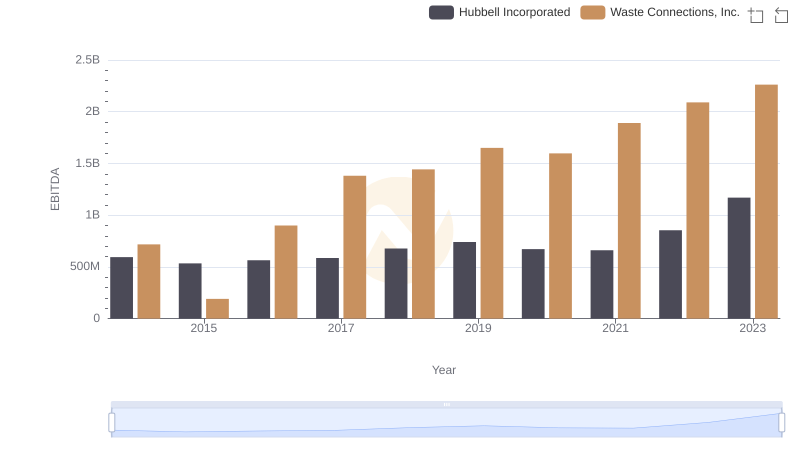
Waste Connections, Inc. vs Hubbell Incorporated: In-Depth EBITDA Performance Comparison