| __timestamp | Hubbell Incorporated | Waste Connections, Inc. |
|---|---|---|
| Wednesday, January 1, 2014 | 3359400000 | 2079166000 |
| Thursday, January 1, 2015 | 3390400000 | 2117287000 |
| Friday, January 1, 2016 | 3505200000 | 3375863000 |
| Sunday, January 1, 2017 | 3668800000 | 4630488000 |
| Monday, January 1, 2018 | 4481700000 | 4922941000 |
| Tuesday, January 1, 2019 | 4591000000 | 5388679000 |
| Wednesday, January 1, 2020 | 4186000000 | 5445990000 |
| Friday, January 1, 2021 | 4194100000 | 6151361000 |
| Saturday, January 1, 2022 | 4947900000 | 7211859000 |
| Sunday, January 1, 2023 | 5372900000 | 8021951000 |
| Monday, January 1, 2024 | 5628500000 | 8919591000 |
Igniting the spark of knowledge
In the ever-evolving landscape of the waste management and electrical equipment industries, Waste Connections, Inc. and Hubbell Incorporated have emerged as formidable players. Over the past decade, from 2014 to 2023, these companies have demonstrated remarkable revenue growth, reflecting their strategic prowess and market adaptability.
Waste Connections, Inc. has seen its revenue surge by approximately 286%, starting from a modest $2.08 billion in 2014 to an impressive $8.02 billion in 2023. This growth trajectory underscores the company's ability to capitalize on the increasing demand for efficient waste management solutions.
Meanwhile, Hubbell Incorporated has also experienced a steady revenue increase of around 60%, growing from $3.36 billion in 2014 to $5.37 billion in 2023. This growth highlights Hubbell's commitment to innovation and its stronghold in the electrical equipment sector.
As these companies continue to expand, their financial performance offers valuable insights into the broader economic trends and industry dynamics.
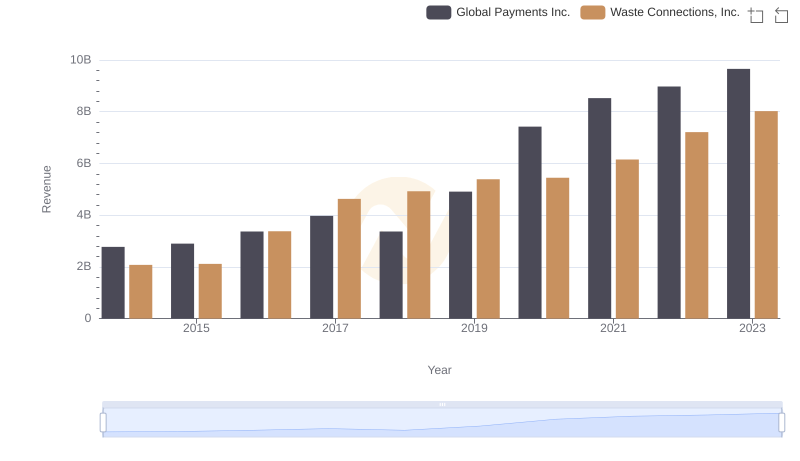
Breaking Down Revenue Trends: Waste Connections, Inc. vs Global Payments Inc.
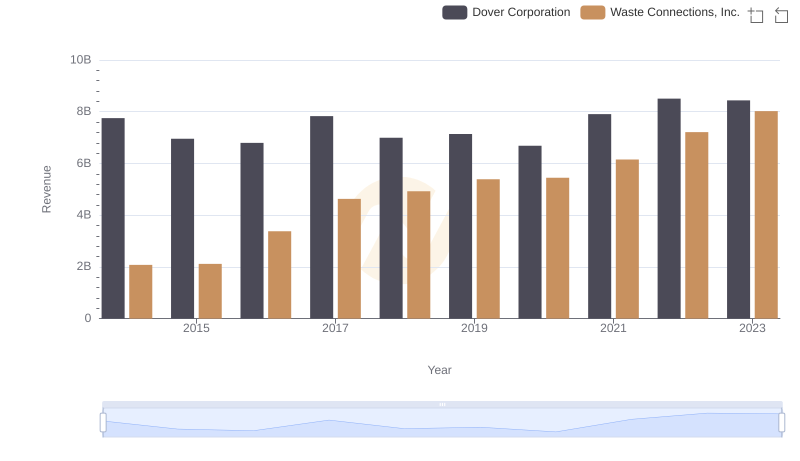
Revenue Showdown: Waste Connections, Inc. vs Dover Corporation
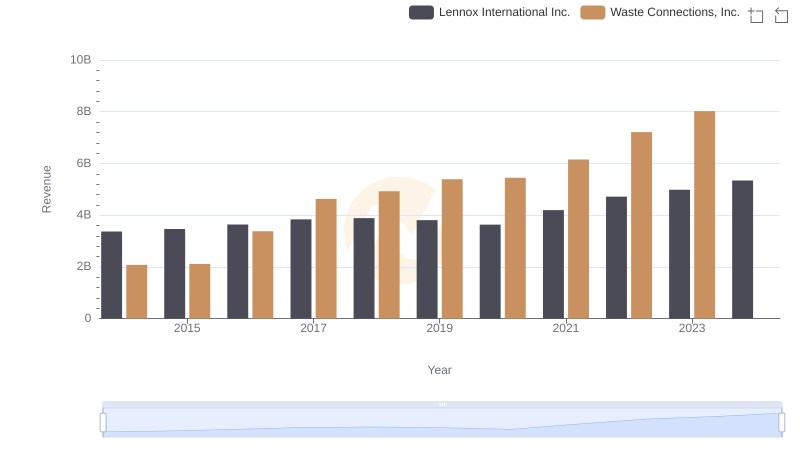
Revenue Insights: Waste Connections, Inc. and Lennox International Inc. Performance Compared
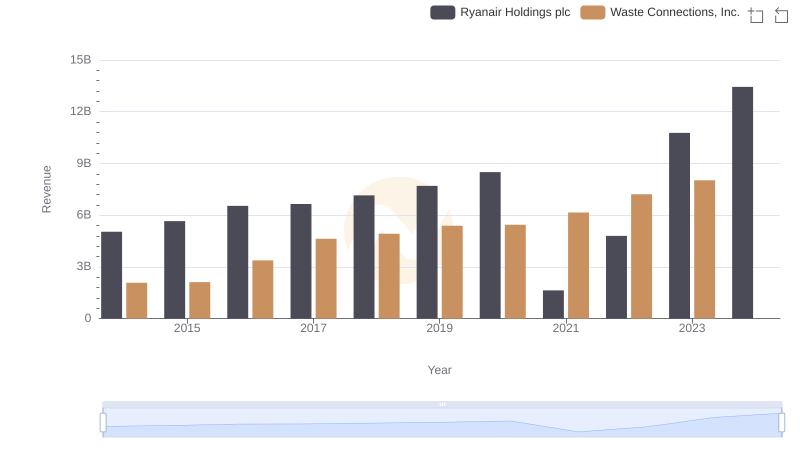
Waste Connections, Inc. vs Ryanair Holdings plc: Examining Key Revenue Metrics
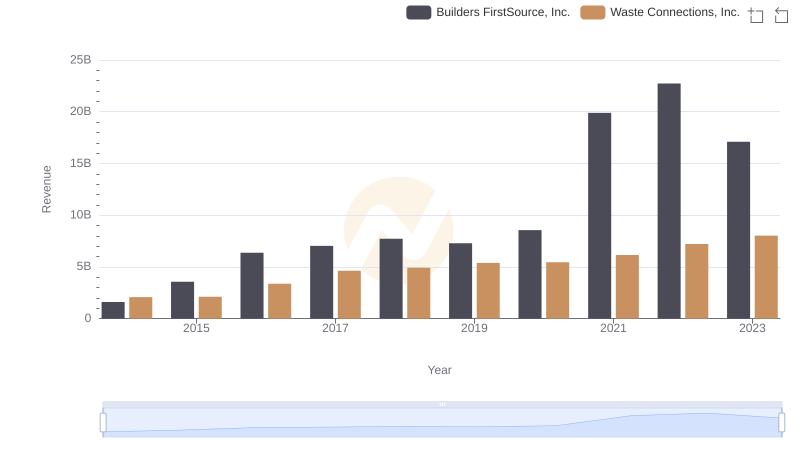
Who Generates More Revenue? Waste Connections, Inc. or Builders FirstSource, Inc.
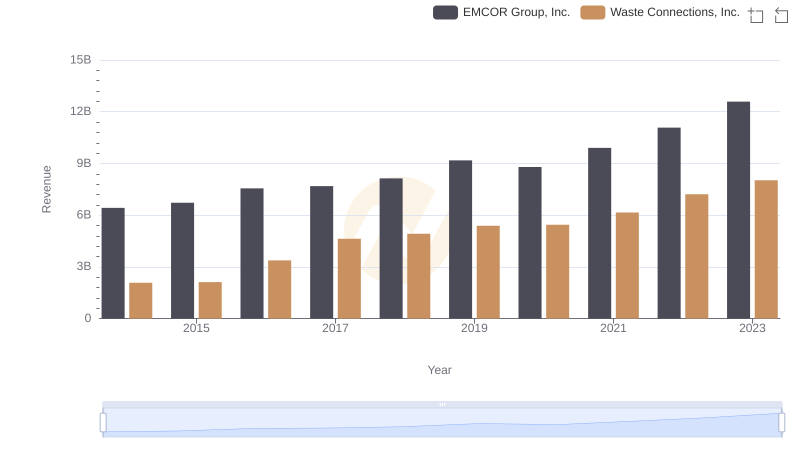
Breaking Down Revenue Trends: Waste Connections, Inc. vs EMCOR Group, Inc.
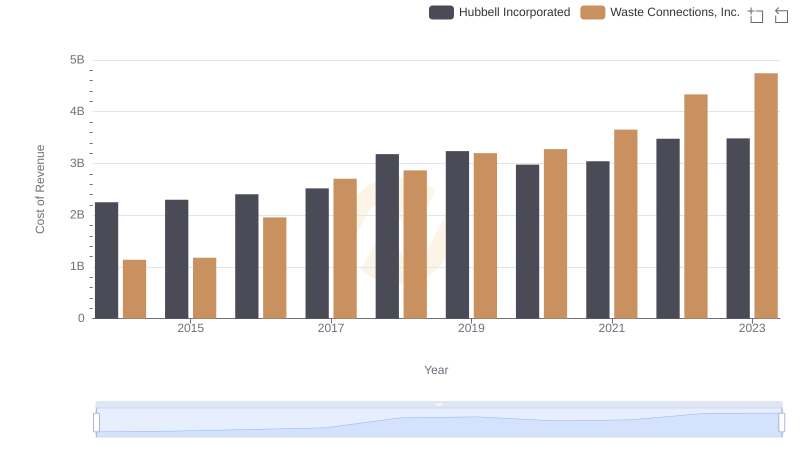
Cost of Revenue Trends: Waste Connections, Inc. vs Hubbell Incorporated
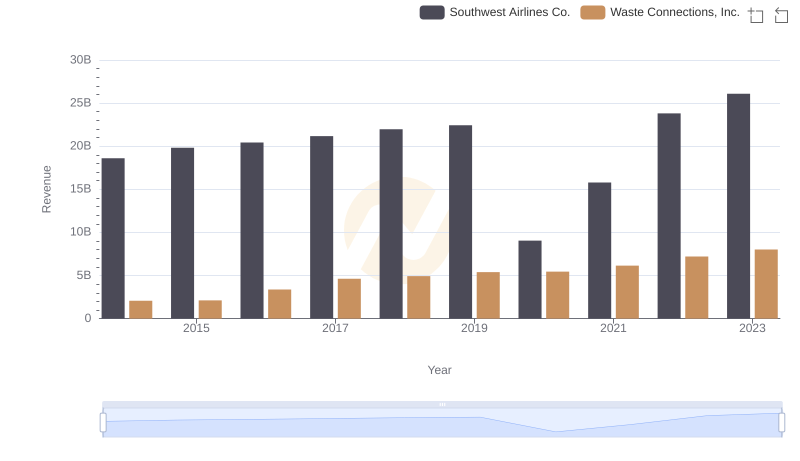
Annual Revenue Comparison: Waste Connections, Inc. vs Southwest Airlines Co.
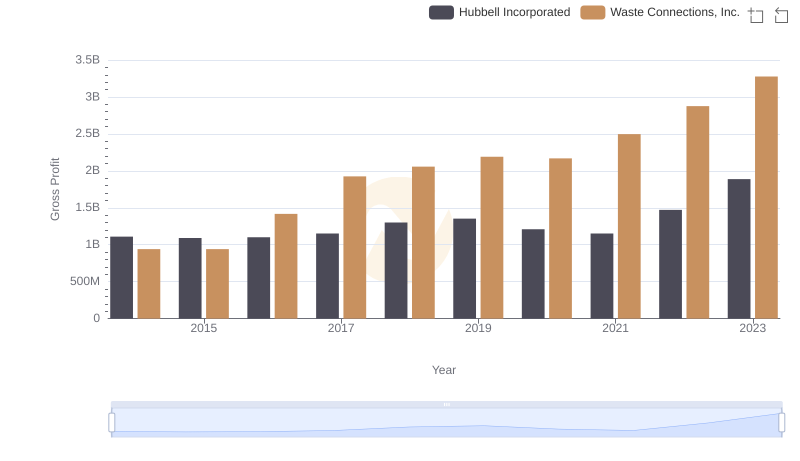
Waste Connections, Inc. and Hubbell Incorporated: A Detailed Gross Profit Analysis
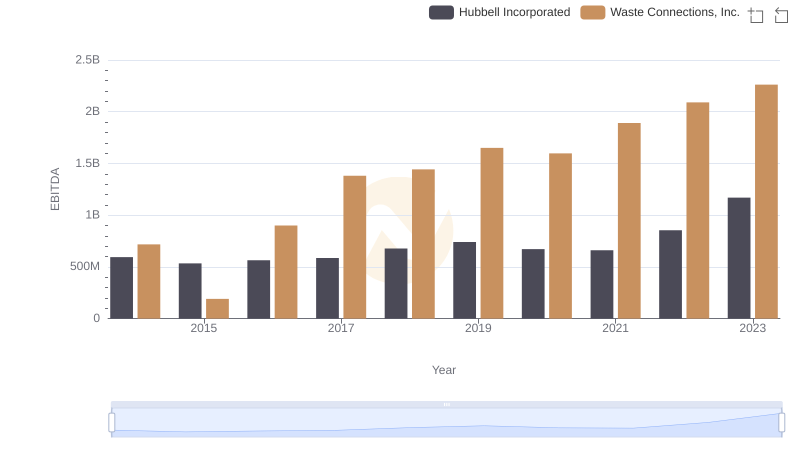
Waste Connections, Inc. vs Hubbell Incorporated: In-Depth EBITDA Performance Comparison