| __timestamp | Lennox International Inc. | Waste Connections, Inc. |
|---|---|---|
| Wednesday, January 1, 2014 | 2464100000 | 1138388000 |
| Thursday, January 1, 2015 | 2520000000 | 1177409000 |
| Friday, January 1, 2016 | 2565100000 | 1957712000 |
| Sunday, January 1, 2017 | 2714400000 | 2704775000 |
| Monday, January 1, 2018 | 2772700000 | 2865704000 |
| Tuesday, January 1, 2019 | 2727400000 | 3198757000 |
| Wednesday, January 1, 2020 | 2594000000 | 3276808000 |
| Friday, January 1, 2021 | 3005700000 | 3654074000 |
| Saturday, January 1, 2022 | 3433700000 | 4336012000 |
| Sunday, January 1, 2023 | 3434100000 | 4744513000 |
| Monday, January 1, 2024 | 3569400000 | 5191706000 |
Unleashing the power of data
In the ever-evolving landscape of corporate efficiency, Waste Connections, Inc. and Lennox International Inc. present a fascinating study in cost management. Over the past decade, from 2014 to 2023, these two industry giants have showcased distinct trajectories in their cost of revenue. Waste Connections, Inc. has seen a remarkable increase of approximately 316% in its cost of revenue, peaking at $4.74 billion in 2023. In contrast, Lennox International Inc. has experienced a more modest growth of around 45%, reaching $3.43 billion in the same year.
This divergence highlights Waste Connections, Inc.'s aggressive expansion strategy, while Lennox International Inc. maintains a steady, controlled growth. The data for 2024 is incomplete, offering a tantalizing glimpse into future trends. As these companies continue to navigate the complexities of their respective industries, their cost efficiency strategies will remain a critical factor in their ongoing success.
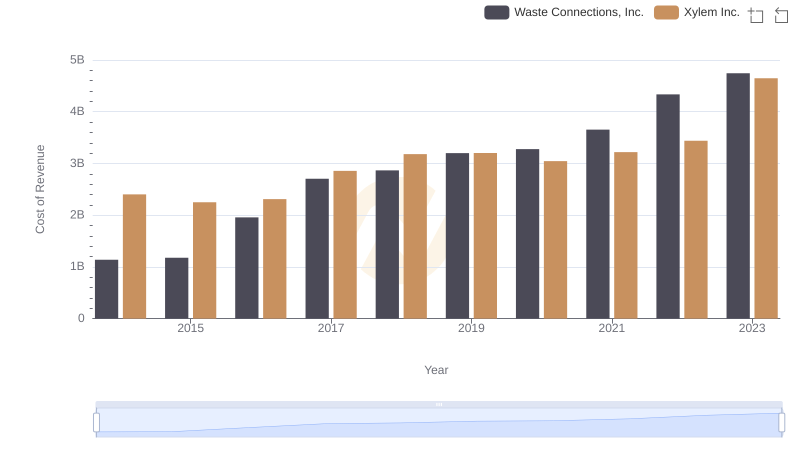
Cost of Revenue: Key Insights for Waste Connections, Inc. and Xylem Inc.
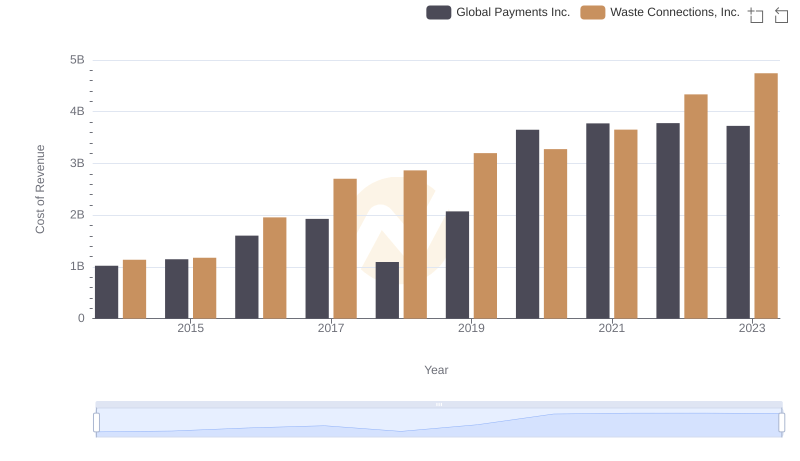
Cost Insights: Breaking Down Waste Connections, Inc. and Global Payments Inc.'s Expenses
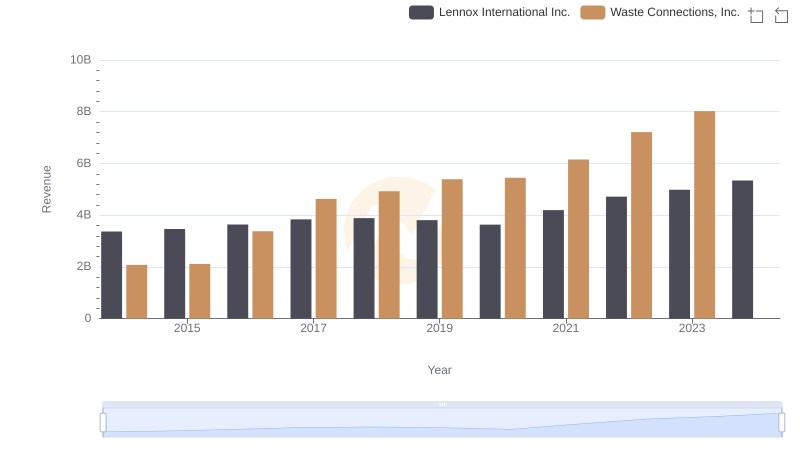
Revenue Insights: Waste Connections, Inc. and Lennox International Inc. Performance Compared
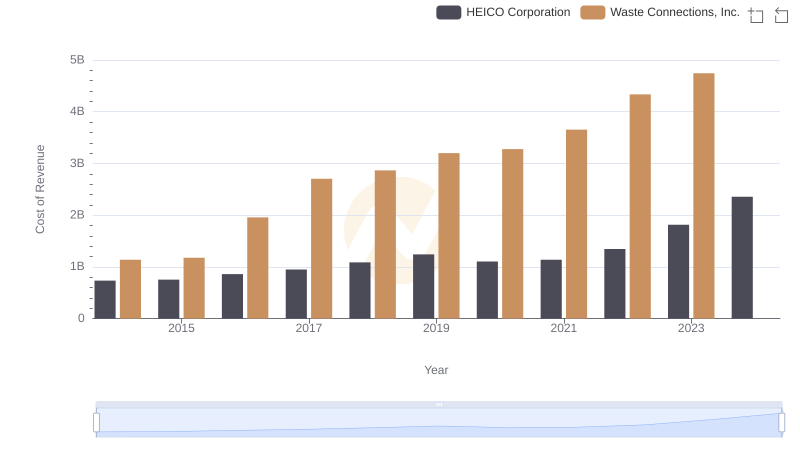
Comparing Cost of Revenue Efficiency: Waste Connections, Inc. vs HEICO Corporation
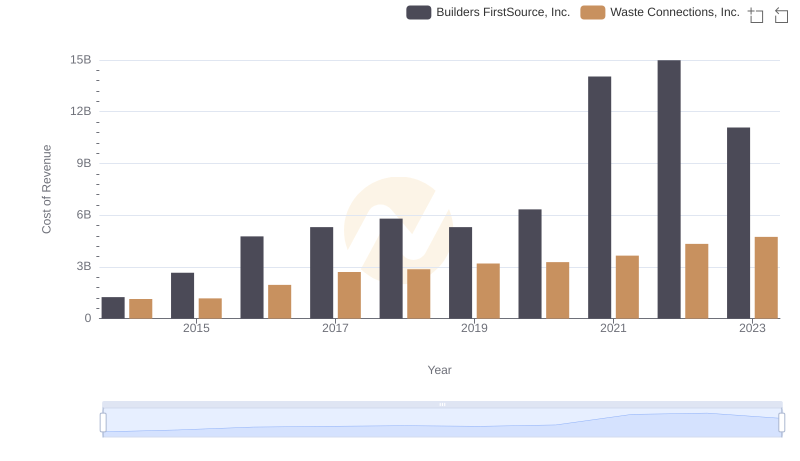
Comparing Cost of Revenue Efficiency: Waste Connections, Inc. vs Builders FirstSource, Inc.

Cost of Revenue: Key Insights for Waste Connections, Inc. and Ryanair Holdings plc
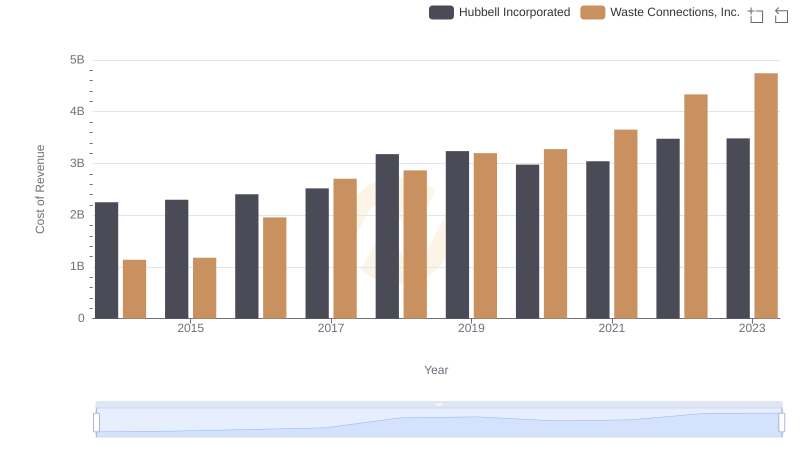
Cost of Revenue Trends: Waste Connections, Inc. vs Hubbell Incorporated
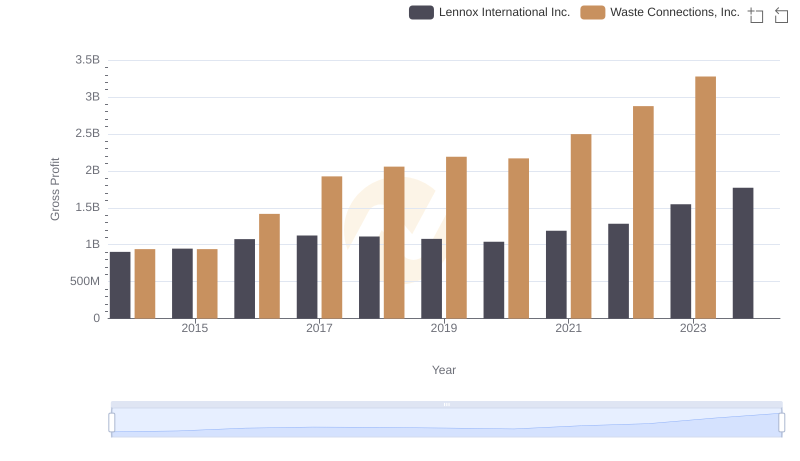
Who Generates Higher Gross Profit? Waste Connections, Inc. or Lennox International Inc.
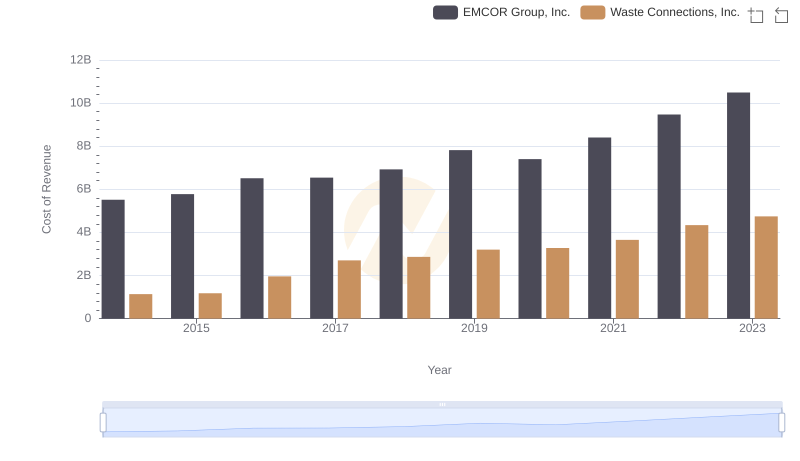
Cost of Revenue Comparison: Waste Connections, Inc. vs EMCOR Group, Inc.
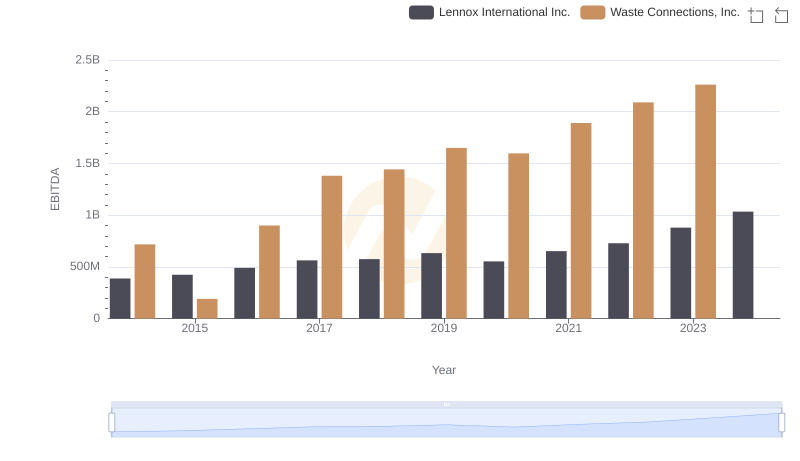
A Side-by-Side Analysis of EBITDA: Waste Connections, Inc. and Lennox International Inc.