| __timestamp | EMCOR Group, Inc. | Waste Connections, Inc. |
|---|---|---|
| Wednesday, January 1, 2014 | 5517719000 | 1138388000 |
| Thursday, January 1, 2015 | 5774247000 | 1177409000 |
| Friday, January 1, 2016 | 6513662000 | 1957712000 |
| Sunday, January 1, 2017 | 6539987000 | 2704775000 |
| Monday, January 1, 2018 | 6925178000 | 2865704000 |
| Tuesday, January 1, 2019 | 7818743000 | 3198757000 |
| Wednesday, January 1, 2020 | 7401679000 | 3276808000 |
| Friday, January 1, 2021 | 8401843000 | 3654074000 |
| Saturday, January 1, 2022 | 9472526000 | 4336012000 |
| Sunday, January 1, 2023 | 10493534000 | 4744513000 |
| Monday, January 1, 2024 | 5191706000 |
Data in motion
In the ever-evolving landscape of industrial services, Waste Connections, Inc. and EMCOR Group, Inc. have emerged as formidable players. Over the past decade, from 2014 to 2023, these companies have demonstrated contrasting trajectories in their cost of revenue.
EMCOR Group, Inc. has seen a consistent rise in its cost of revenue, growing by approximately 90% over the period. Starting at $5.5 billion in 2014, it reached a peak of $10.5 billion in 2023. This growth reflects EMCOR's expanding operations and increased market demand.
Conversely, Waste Connections, Inc. has experienced a more rapid increase, with its cost of revenue surging by over 300% from $1.1 billion in 2014 to $4.7 billion in 2023. This remarkable growth underscores the company's aggressive expansion strategy and its ability to capture new market segments.
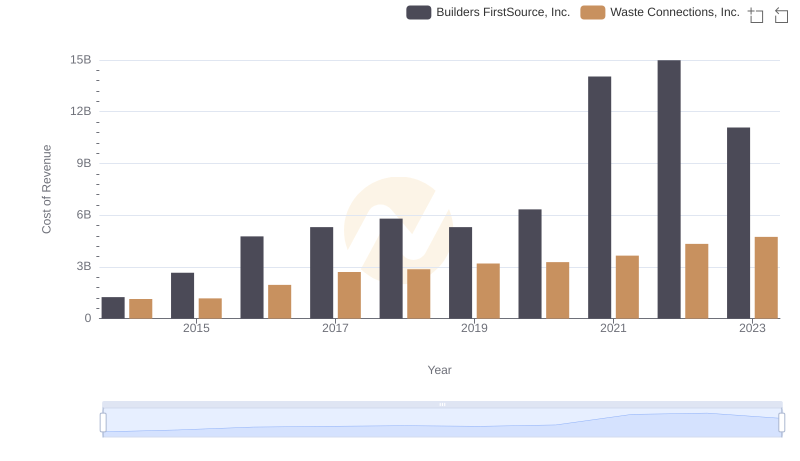
Comparing Cost of Revenue Efficiency: Waste Connections, Inc. vs Builders FirstSource, Inc.
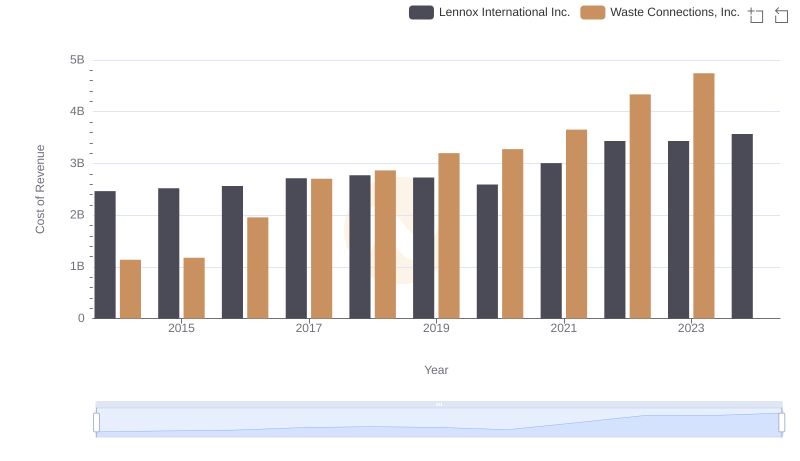
Waste Connections, Inc. vs Lennox International Inc.: Efficiency in Cost of Revenue Explored

Cost of Revenue: Key Insights for Waste Connections, Inc. and Ryanair Holdings plc
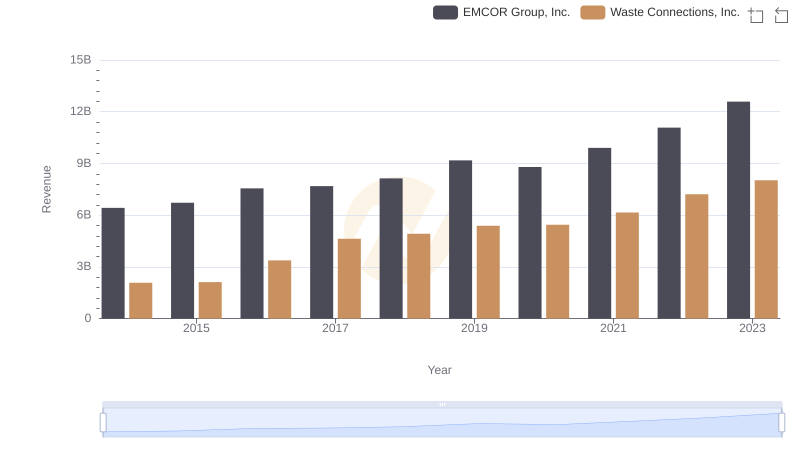
Breaking Down Revenue Trends: Waste Connections, Inc. vs EMCOR Group, Inc.
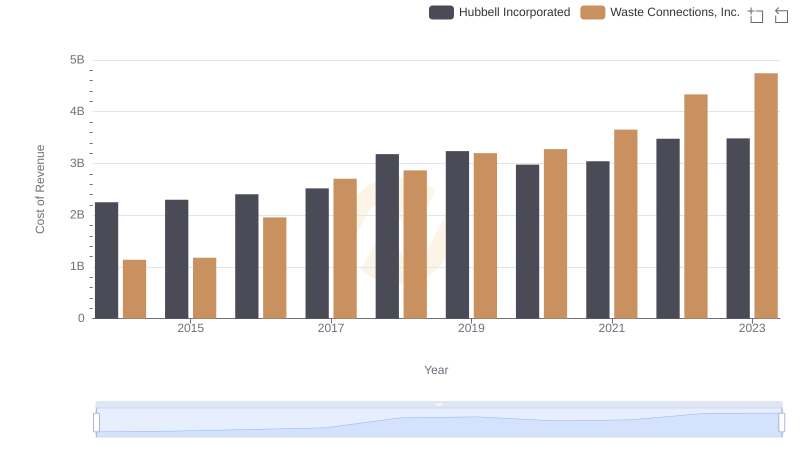
Cost of Revenue Trends: Waste Connections, Inc. vs Hubbell Incorporated
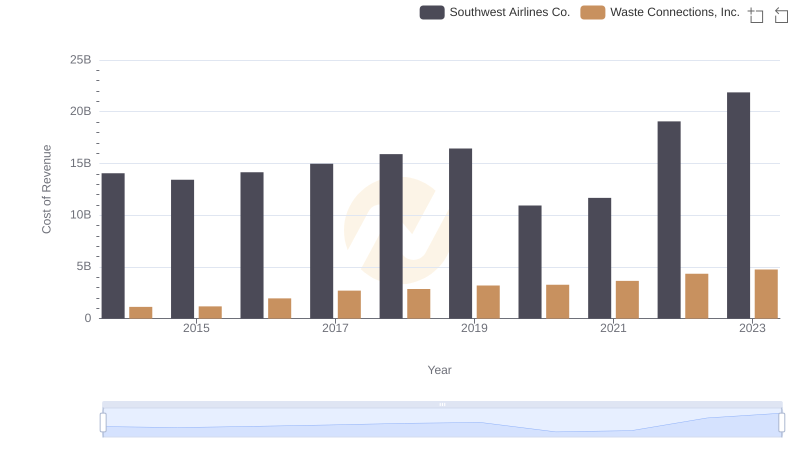
Cost of Revenue Comparison: Waste Connections, Inc. vs Southwest Airlines Co.
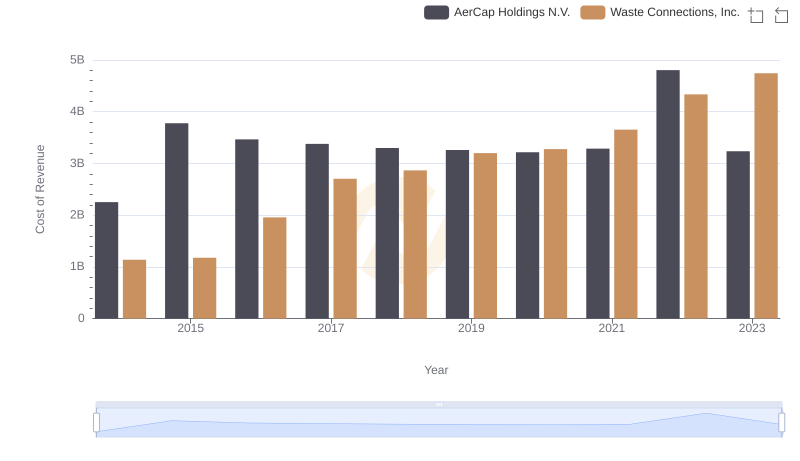
Cost Insights: Breaking Down Waste Connections, Inc. and AerCap Holdings N.V.'s Expenses
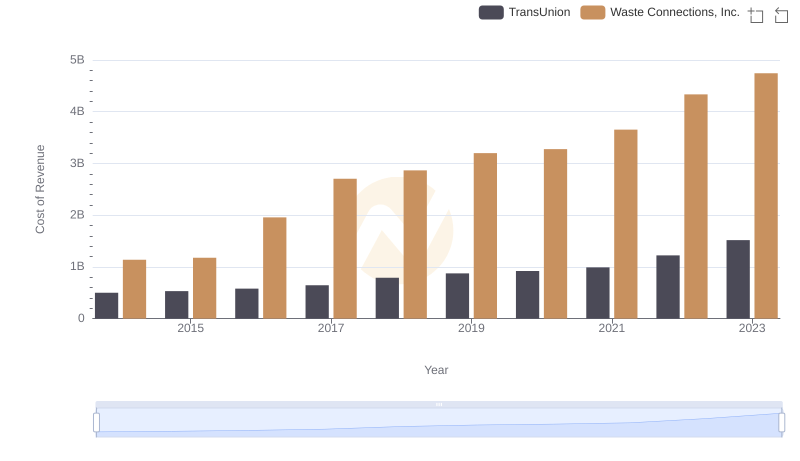
Cost of Revenue Comparison: Waste Connections, Inc. vs TransUnion
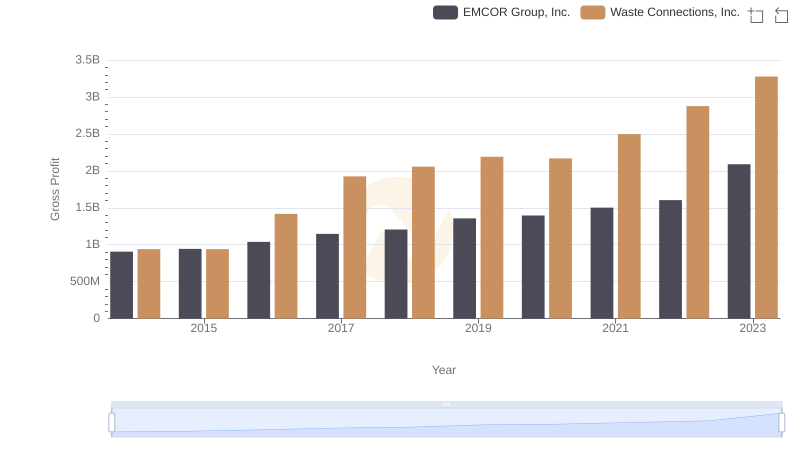
Gross Profit Trends Compared: Waste Connections, Inc. vs EMCOR Group, Inc.