| __timestamp | Southwest Airlines Co. | Waste Connections, Inc. |
|---|---|---|
| Wednesday, January 1, 2014 | 14049000000 | 1138388000 |
| Thursday, January 1, 2015 | 13423000000 | 1177409000 |
| Friday, January 1, 2016 | 14151000000 | 1957712000 |
| Sunday, January 1, 2017 | 14968000000 | 2704775000 |
| Monday, January 1, 2018 | 15907000000 | 2865704000 |
| Tuesday, January 1, 2019 | 16445000000 | 3198757000 |
| Wednesday, January 1, 2020 | 10938000000 | 3276808000 |
| Friday, January 1, 2021 | 11675000000 | 3654074000 |
| Saturday, January 1, 2022 | 19062000000 | 4336012000 |
| Sunday, January 1, 2023 | 21868000000 | 4744513000 |
| Monday, January 1, 2024 | 23024000000 | 5191706000 |
Data in motion
In the ever-evolving landscape of American business, Waste Connections, Inc. and Southwest Airlines Co. offer a fascinating study in contrasts. Over the past decade, Southwest Airlines has consistently reported a cost of revenue that is approximately five times higher than that of Waste Connections. This disparity highlights the unique challenges and operational scales of the airline and waste management sectors.
From 2014 to 2023, Southwest Airlines saw a 56% increase in its cost of revenue, peaking in 2023. Meanwhile, Waste Connections experienced a remarkable 316% growth over the same period, reflecting its aggressive expansion and operational scaling. The year 2020 marked a significant dip for Southwest, likely due to the global pandemic, while Waste Connections continued its upward trajectory.
These trends underscore the resilience and adaptability of these companies in their respective industries, offering valuable insights for investors and industry analysts alike.
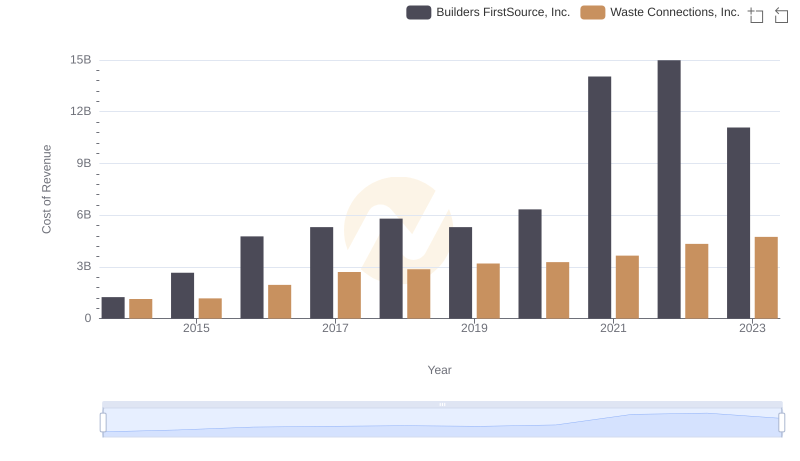
Comparing Cost of Revenue Efficiency: Waste Connections, Inc. vs Builders FirstSource, Inc.
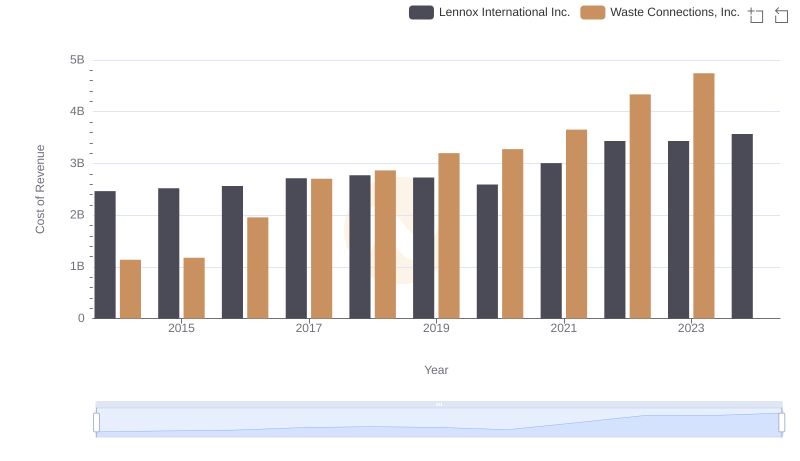
Waste Connections, Inc. vs Lennox International Inc.: Efficiency in Cost of Revenue Explored

Cost of Revenue: Key Insights for Waste Connections, Inc. and Ryanair Holdings plc
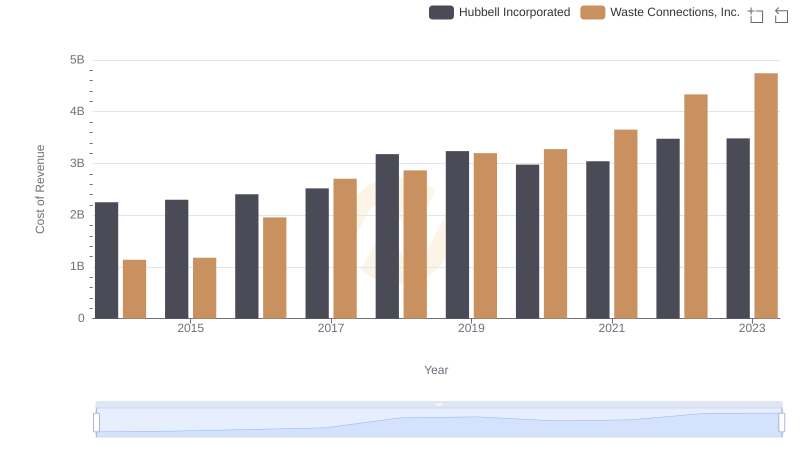
Cost of Revenue Trends: Waste Connections, Inc. vs Hubbell Incorporated
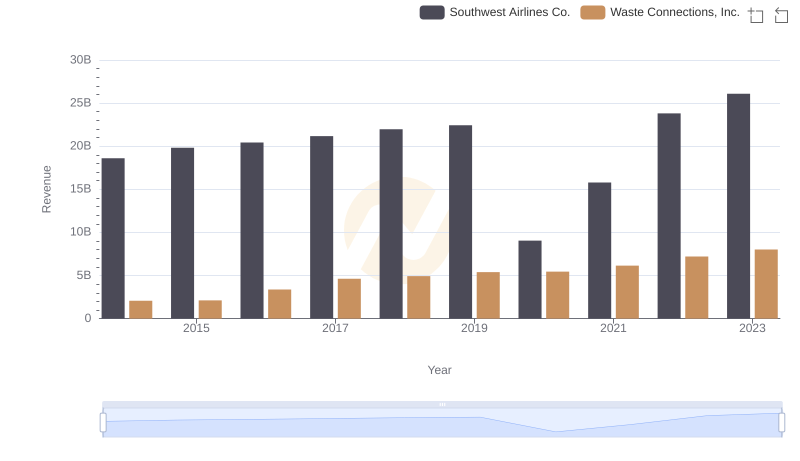
Annual Revenue Comparison: Waste Connections, Inc. vs Southwest Airlines Co.
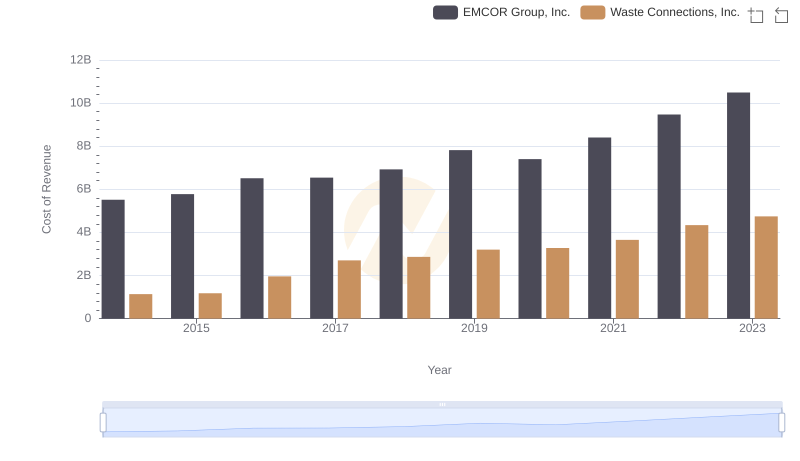
Cost of Revenue Comparison: Waste Connections, Inc. vs EMCOR Group, Inc.
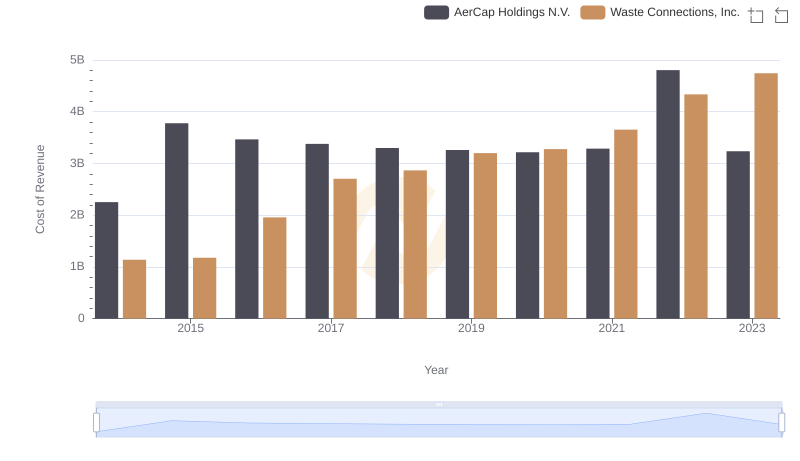
Cost Insights: Breaking Down Waste Connections, Inc. and AerCap Holdings N.V.'s Expenses
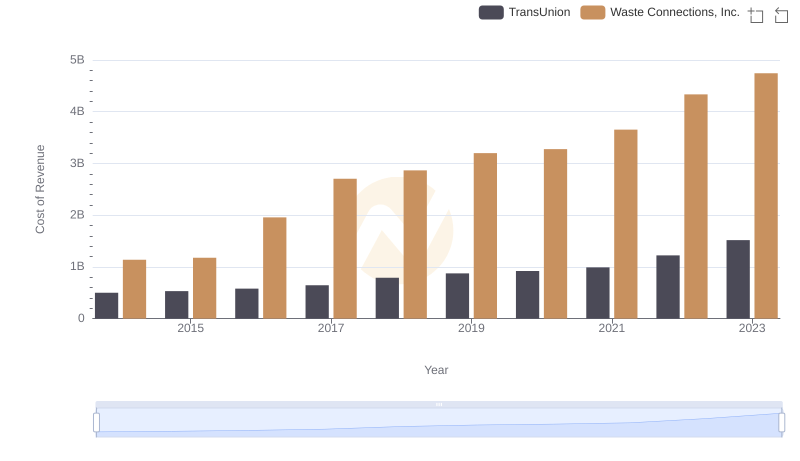
Cost of Revenue Comparison: Waste Connections, Inc. vs TransUnion
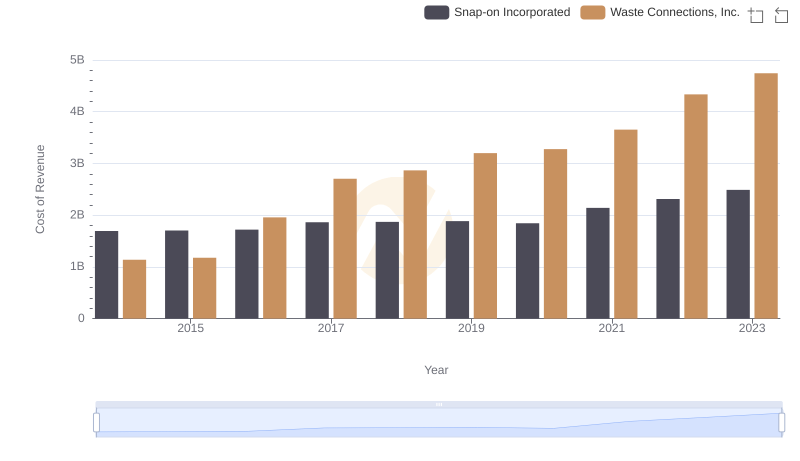
Waste Connections, Inc. vs Snap-on Incorporated: Efficiency in Cost of Revenue Explored