| __timestamp | HEICO Corporation | Waste Connections, Inc. |
|---|---|---|
| Wednesday, January 1, 2014 | 733999000 | 1138388000 |
| Thursday, January 1, 2015 | 754469000 | 1177409000 |
| Friday, January 1, 2016 | 860766000 | 1957712000 |
| Sunday, January 1, 2017 | 950088000 | 2704775000 |
| Monday, January 1, 2018 | 1087006000 | 2865704000 |
| Tuesday, January 1, 2019 | 1241807000 | 3198757000 |
| Wednesday, January 1, 2020 | 1104882000 | 3276808000 |
| Friday, January 1, 2021 | 1138259000 | 3654074000 |
| Saturday, January 1, 2022 | 1345563000 | 4336012000 |
| Sunday, January 1, 2023 | 1814617000 | 4744513000 |
| Monday, January 1, 2024 | 2355943000 | 5191706000 |
Data in motion
In the competitive landscape of the U.S. stock market, understanding cost efficiency is crucial for investors. Waste Connections, Inc. and HEICO Corporation, two industry giants, have shown distinct trajectories in their cost of revenue over the past decade. From 2014 to 2023, Waste Connections, Inc. has consistently outpaced HEICO Corporation, with its cost of revenue growing by approximately 317%, reaching a peak in 2023. In contrast, HEICO Corporation's cost of revenue increased by about 221% over the same period. This disparity highlights Waste Connections, Inc.'s aggressive expansion and operational scale. However, the data for 2024 is incomplete, leaving room for speculation on future trends. Investors should consider these historical patterns and the potential implications of missing data when evaluating these companies' financial health and strategic direction.
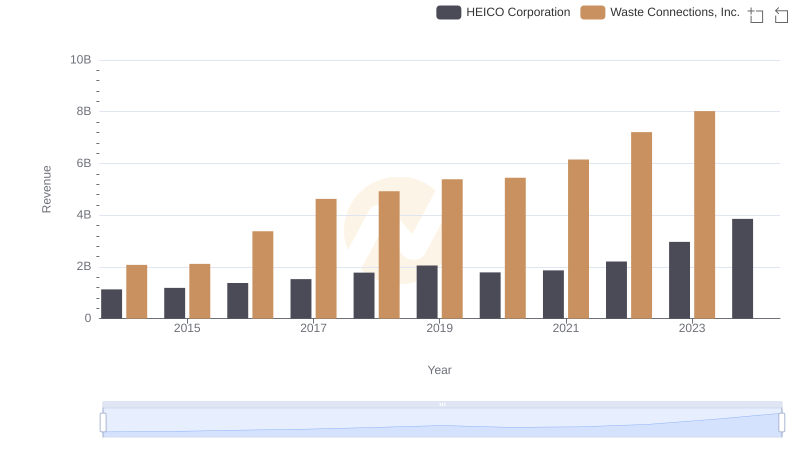
Waste Connections, Inc. vs HEICO Corporation: Examining Key Revenue Metrics
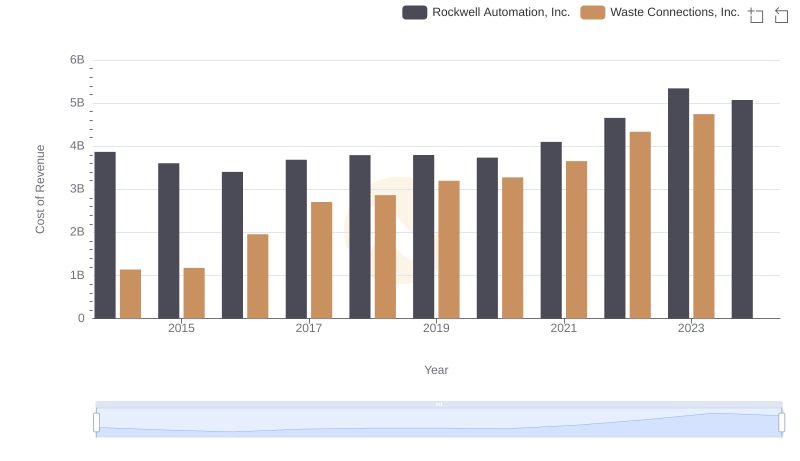
Cost of Revenue: Key Insights for Waste Connections, Inc. and Rockwell Automation, Inc.
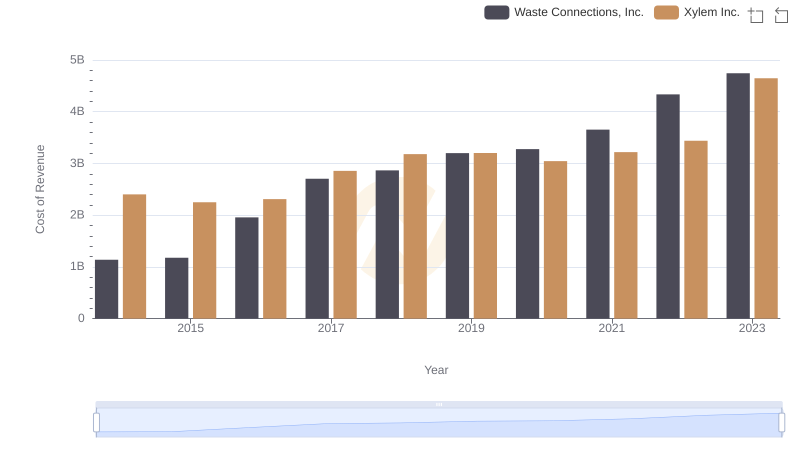
Cost of Revenue: Key Insights for Waste Connections, Inc. and Xylem Inc.
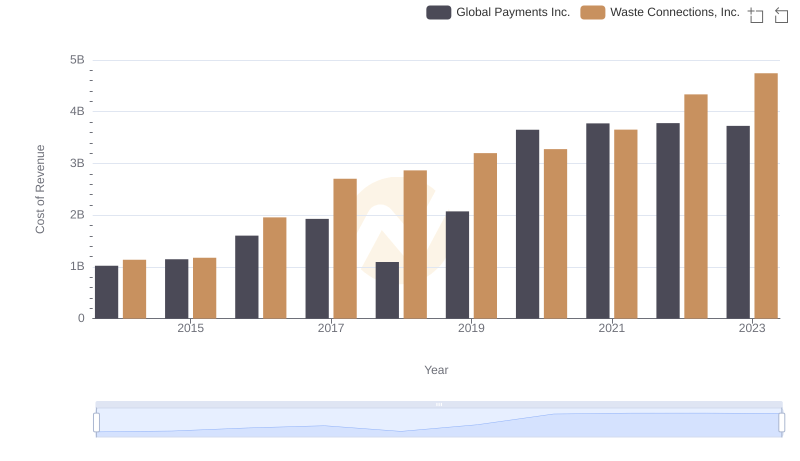
Cost Insights: Breaking Down Waste Connections, Inc. and Global Payments Inc.'s Expenses
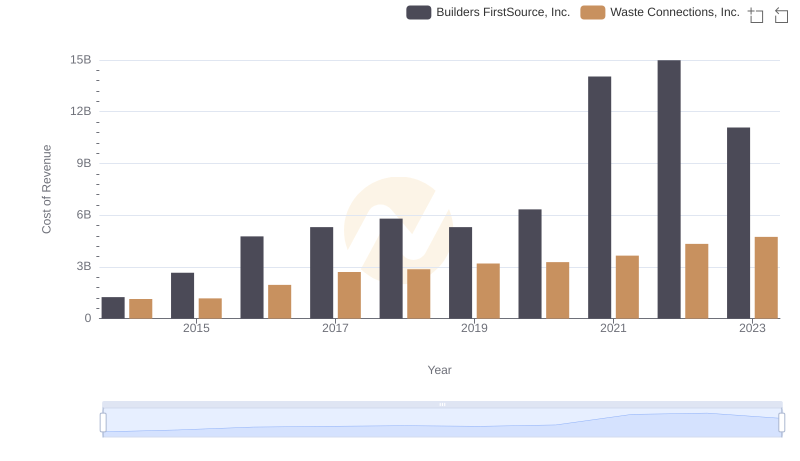
Comparing Cost of Revenue Efficiency: Waste Connections, Inc. vs Builders FirstSource, Inc.
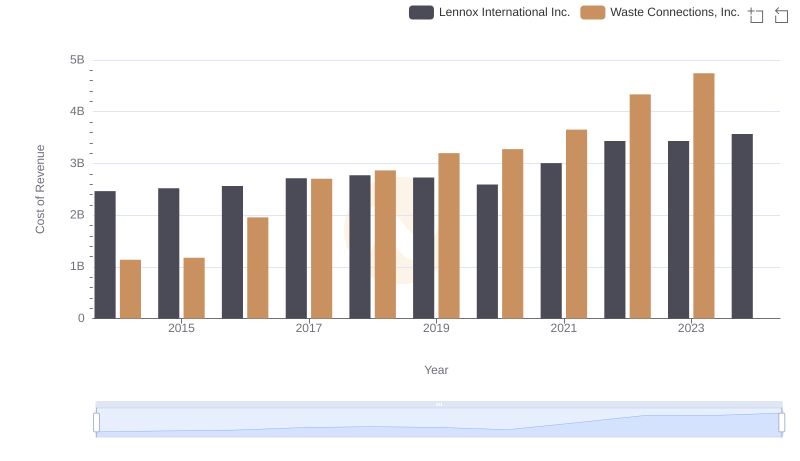
Waste Connections, Inc. vs Lennox International Inc.: Efficiency in Cost of Revenue Explored

Cost of Revenue: Key Insights for Waste Connections, Inc. and Ryanair Holdings plc
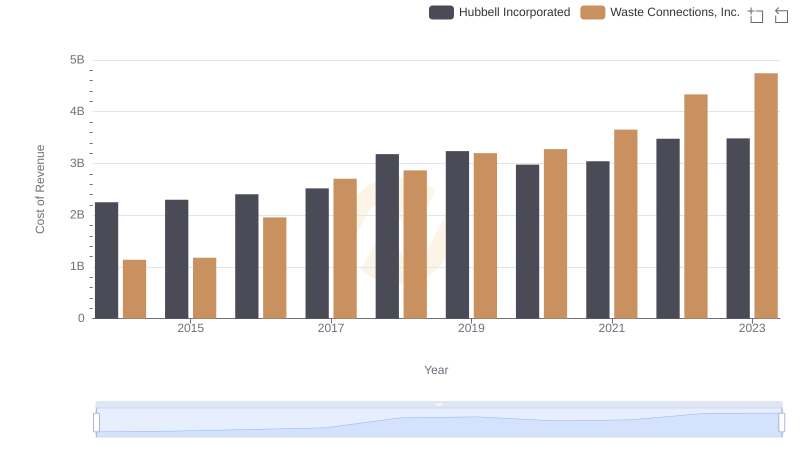
Cost of Revenue Trends: Waste Connections, Inc. vs Hubbell Incorporated
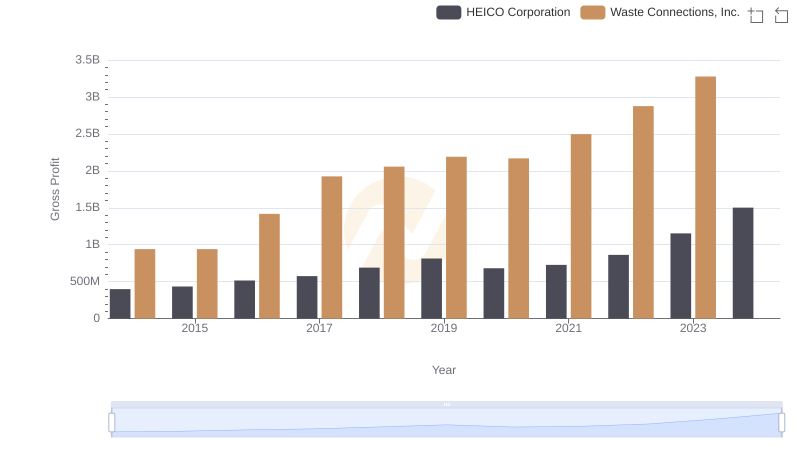
Gross Profit Analysis: Comparing Waste Connections, Inc. and HEICO Corporation
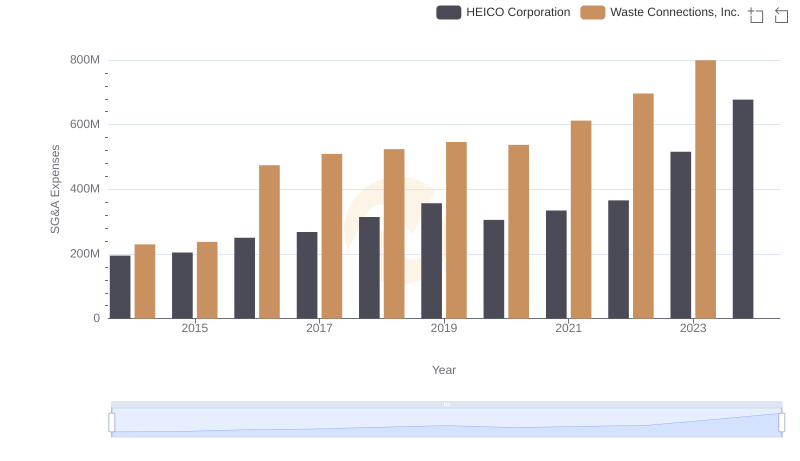
Operational Costs Compared: SG&A Analysis of Waste Connections, Inc. and HEICO Corporation
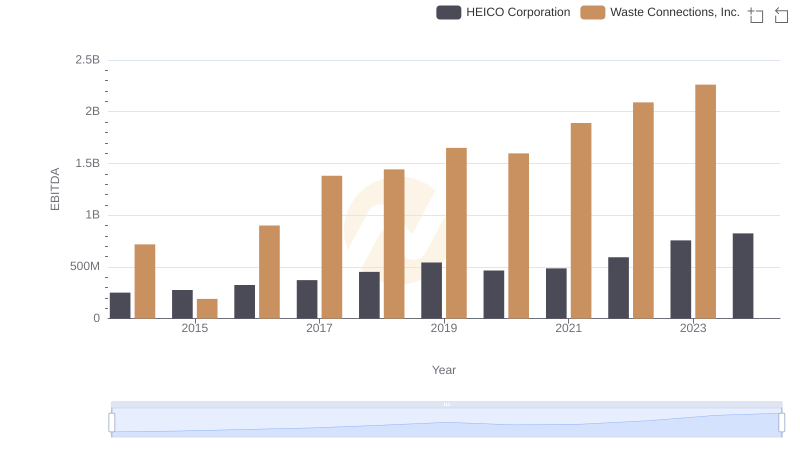
EBITDA Performance Review: Waste Connections, Inc. vs HEICO Corporation