| __timestamp | General Dynamics Corporation | Trane Technologies plc |
|---|---|---|
| Wednesday, January 1, 2014 | 30852000000 | 12891400000 |
| Thursday, January 1, 2015 | 31469000000 | 13300700000 |
| Friday, January 1, 2016 | 31353000000 | 13508900000 |
| Sunday, January 1, 2017 | 30973000000 | 14197600000 |
| Monday, January 1, 2018 | 36193000000 | 15668200000 |
| Tuesday, January 1, 2019 | 39350000000 | 16598900000 |
| Wednesday, January 1, 2020 | 37925000000 | 12454700000 |
| Friday, January 1, 2021 | 38469000000 | 14136400000 |
| Saturday, January 1, 2022 | 39407000000 | 15991700000 |
| Sunday, January 1, 2023 | 42272000000 | 17677600000 |
| Monday, January 1, 2024 | 47716000000 | 19838200000 |
Unleashing insights
In the ever-evolving landscape of industrial giants, Trane Technologies and General Dynamics have carved distinct paths over the past decade. From 2014 to 2023, General Dynamics showcased a robust revenue growth, surging by approximately 37% from 2014 to 2023. This growth trajectory highlights its resilience and strategic prowess in the defense sector. Meanwhile, Trane Technologies, a leader in climate solutions, experienced a commendable 37% increase in revenue from 2014 to 2023, reflecting its adaptability and innovation in sustainable solutions.
Interestingly, 2024 data for Trane Technologies is missing, leaving room for speculation on its future performance. As these two titans continue to navigate their respective industries, their revenue trends offer a fascinating glimpse into their strategic directions and market dynamics. Stay tuned as we delve deeper into their financial narratives and explore what lies ahead for these industry leaders.
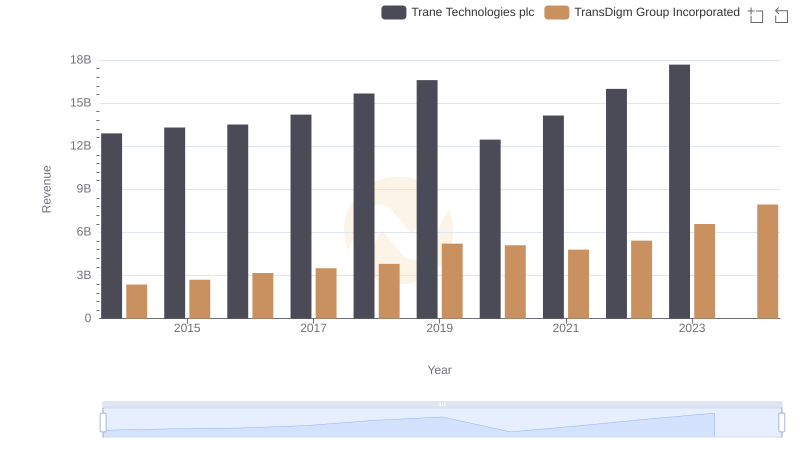
Trane Technologies plc vs TransDigm Group Incorporated: Annual Revenue Growth Compared
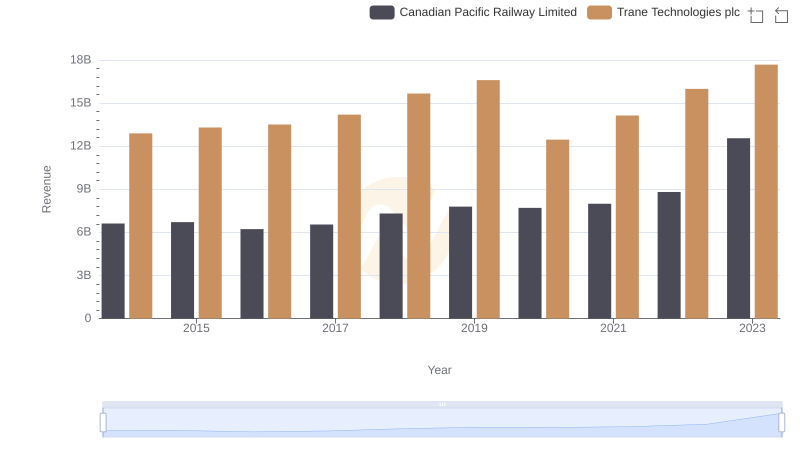
Revenue Showdown: Trane Technologies plc vs Canadian Pacific Railway Limited
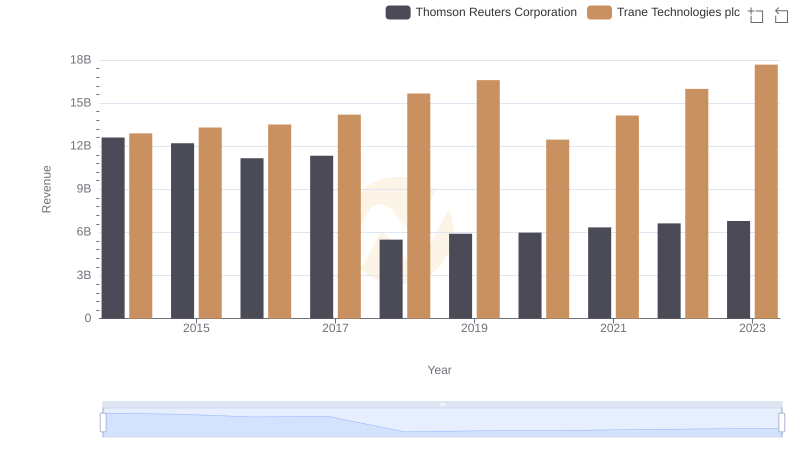
Annual Revenue Comparison: Trane Technologies plc vs Thomson Reuters Corporation
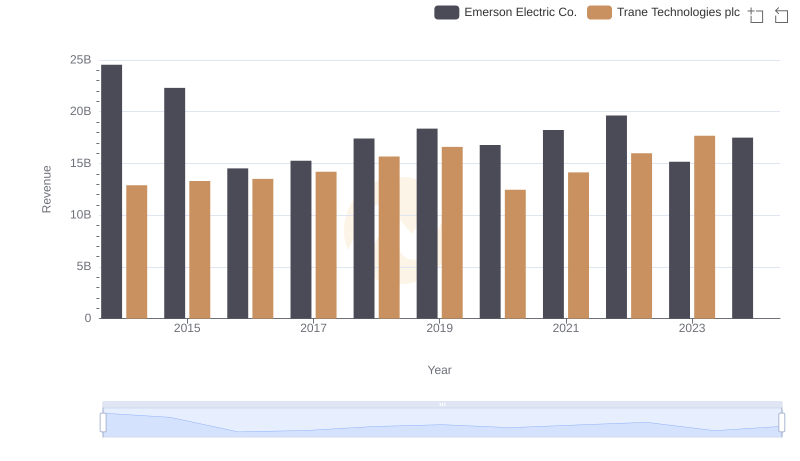
Revenue Insights: Trane Technologies plc and Emerson Electric Co. Performance Compared
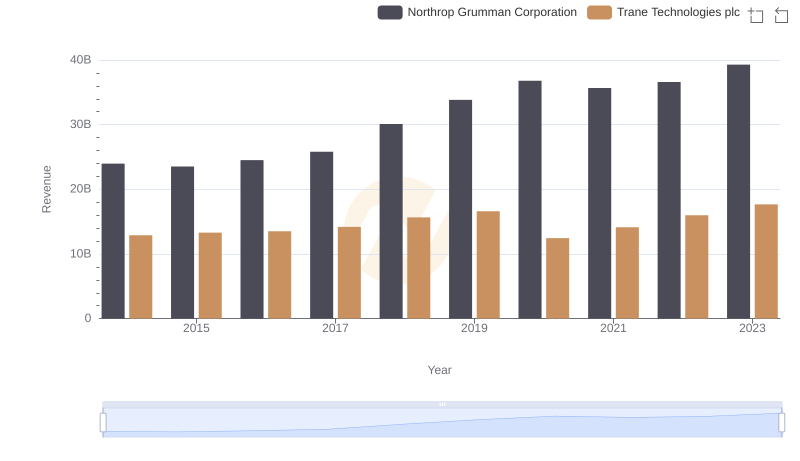
Breaking Down Revenue Trends: Trane Technologies plc vs Northrop Grumman Corporation
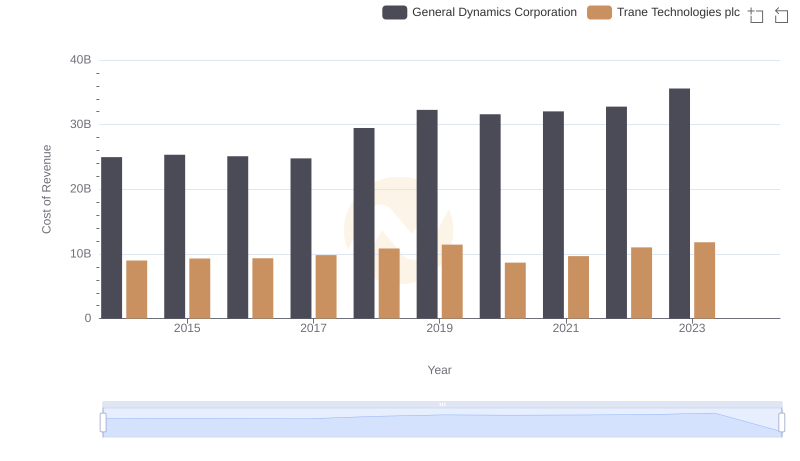
Cost of Revenue Trends: Trane Technologies plc vs General Dynamics Corporation
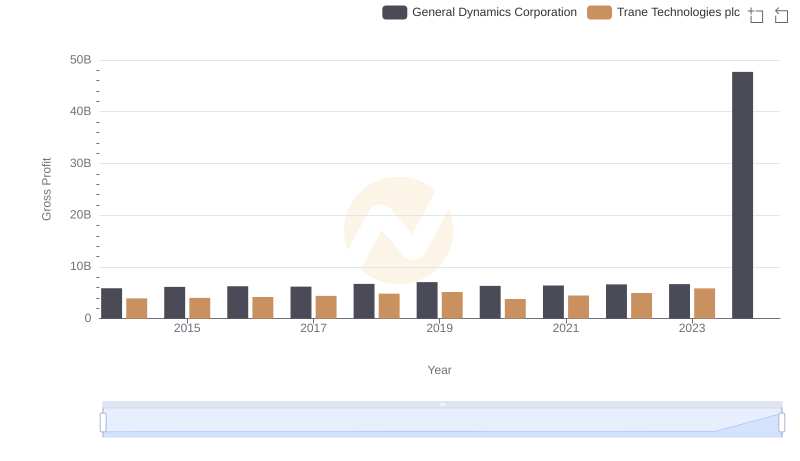
Trane Technologies plc vs General Dynamics Corporation: A Gross Profit Performance Breakdown
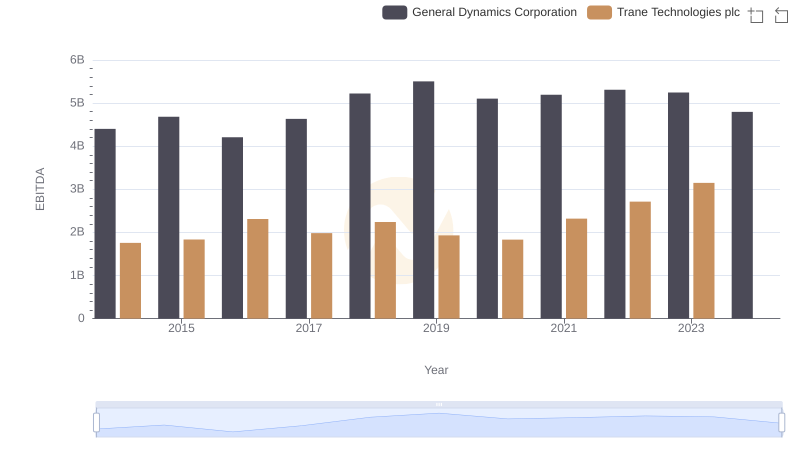
Professional EBITDA Benchmarking: Trane Technologies plc vs General Dynamics Corporation