| __timestamp | FedEx Corporation | Trane Technologies plc |
|---|---|---|
| Wednesday, January 1, 2014 | 6036000000 | 1757000000 |
| Thursday, January 1, 2015 | 7141000000 | 1835000000 |
| Friday, January 1, 2016 | 7531000000 | 2311000000 |
| Sunday, January 1, 2017 | 8093000000 | 1982500000 |
| Monday, January 1, 2018 | 8555000000 | 2242400000 |
| Tuesday, January 1, 2019 | 4934000000 | 1931200000 |
| Wednesday, January 1, 2020 | 6345000000 | 1831900000 |
| Friday, January 1, 2021 | 11749000000 | 2319200000 |
| Saturday, January 1, 2022 | 9767000000 | 2715500000 |
| Sunday, January 1, 2023 | 10603000000 | 3149900000 |
| Monday, January 1, 2024 | 10868000000 | 3859600000 |
In pursuit of knowledge
In the ever-evolving landscape of global business, understanding the financial health of industry giants is crucial. Over the past decade, FedEx Corporation and Trane Technologies plc have showcased distinct EBITDA trajectories, reflecting their strategic maneuvers and market conditions.
From 2014 to 2023, FedEx's EBITDA grew by approximately 76%, peaking in 2023. This growth underscores FedEx's resilience and adaptability in the logistics sector, even amidst global disruptions.
Trane Technologies, a leader in climate solutions, saw a 79% increase in EBITDA from 2014 to 2023. Despite missing data for 2024, the company's upward trend highlights its commitment to innovation and sustainability.
Both companies exemplify robust financial strategies, yet their paths diverge, offering valuable insights into their respective industries.
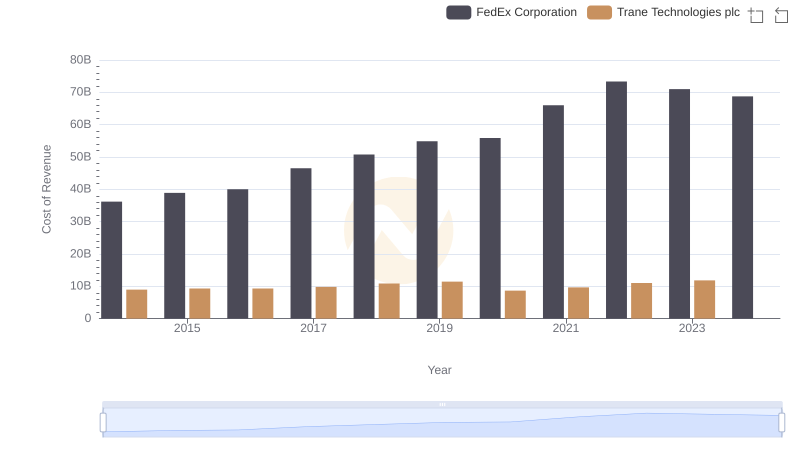
Cost of Revenue Trends: Trane Technologies plc vs FedEx Corporation
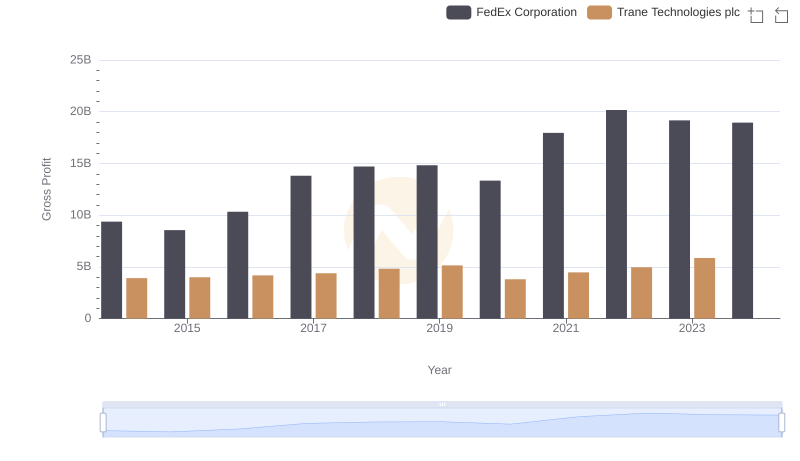
Gross Profit Trends Compared: Trane Technologies plc vs FedEx Corporation
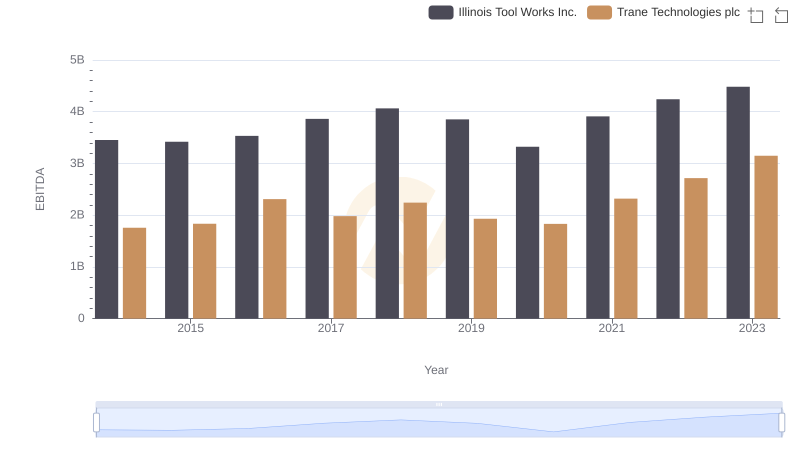
EBITDA Performance Review: Trane Technologies plc vs Illinois Tool Works Inc.
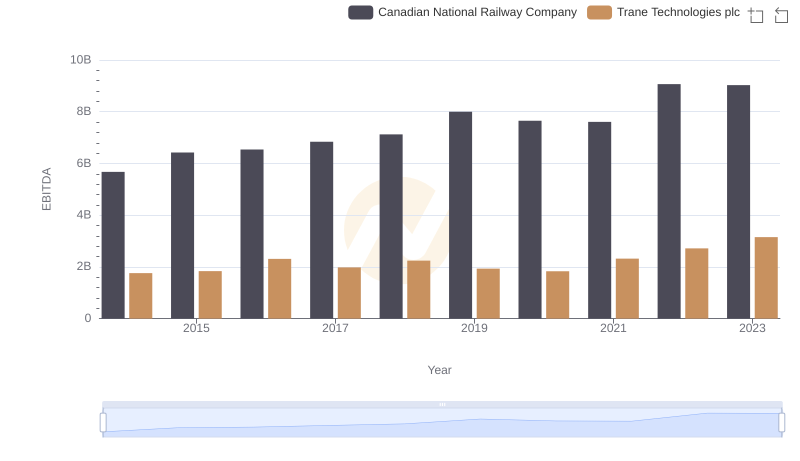
A Professional Review of EBITDA: Trane Technologies plc Compared to Canadian National Railway Company
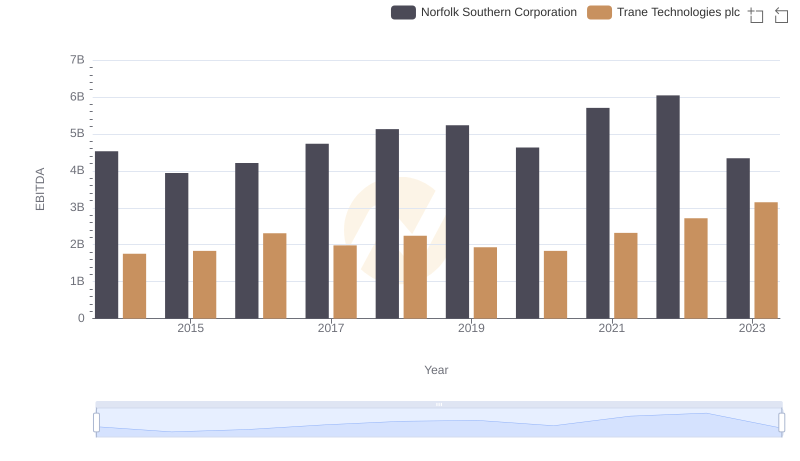
EBITDA Analysis: Evaluating Trane Technologies plc Against Norfolk Southern Corporation
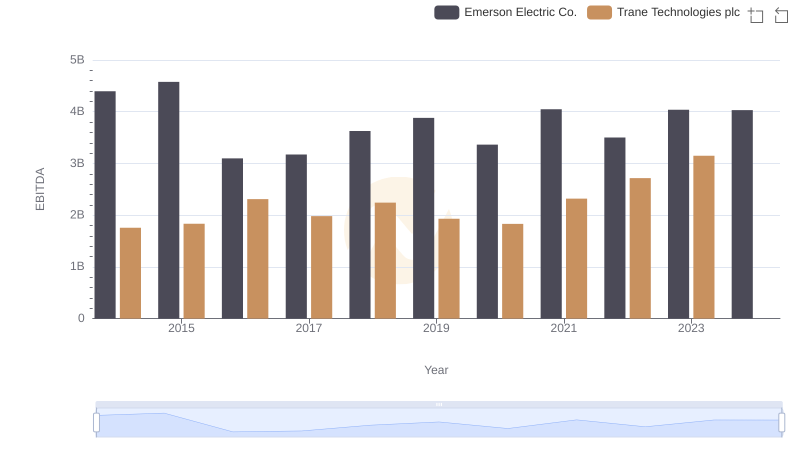
Comparative EBITDA Analysis: Trane Technologies plc vs Emerson Electric Co.
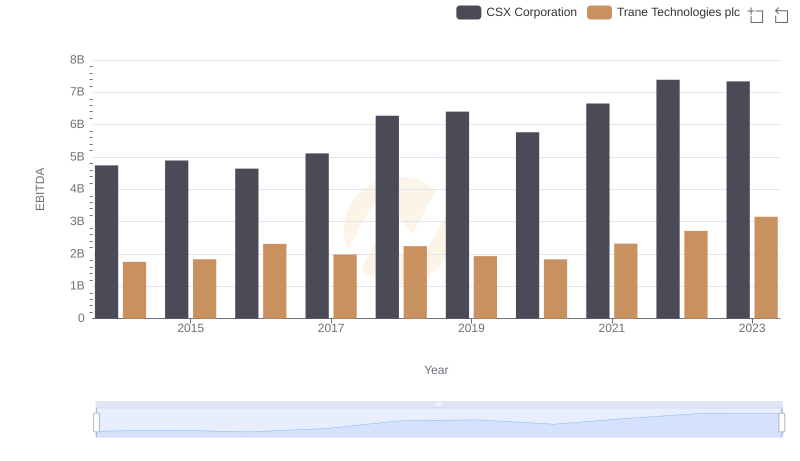
EBITDA Performance Review: Trane Technologies plc vs CSX Corporation
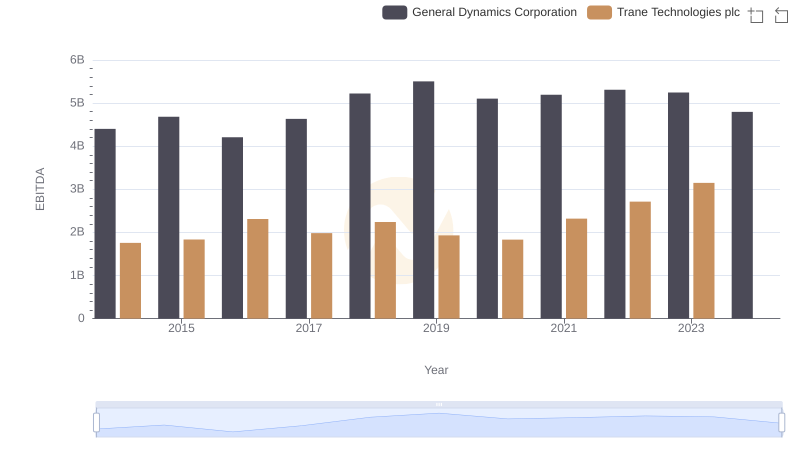
Professional EBITDA Benchmarking: Trane Technologies plc vs General Dynamics Corporation
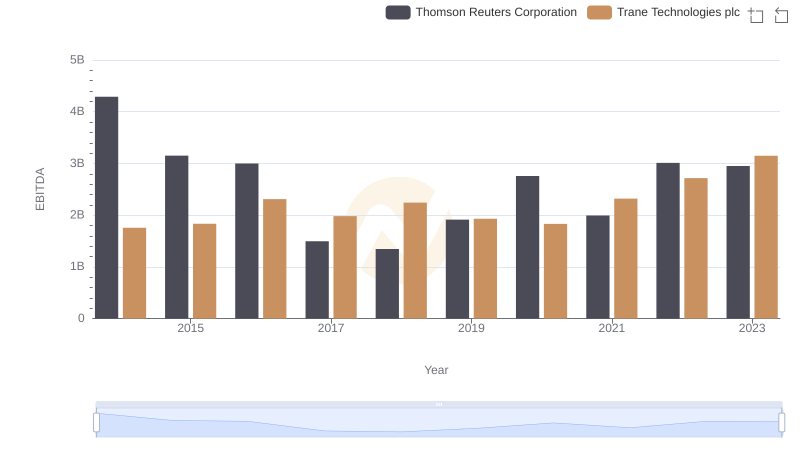
A Side-by-Side Analysis of EBITDA: Trane Technologies plc and Thomson Reuters Corporation