| __timestamp | Hubbell Incorporated | Ryanair Holdings plc |
|---|---|---|
| Wednesday, January 1, 2014 | 2250400000 | 3838100000 |
| Thursday, January 1, 2015 | 2298600000 | 3999600000 |
| Friday, January 1, 2016 | 2404500000 | 4355900000 |
| Sunday, January 1, 2017 | 2516900000 | 4294000000 |
| Monday, January 1, 2018 | 3181300000 | 4512300000 |
| Tuesday, January 1, 2019 | 3238300000 | 5492800000 |
| Wednesday, January 1, 2020 | 2976700000 | 6039900000 |
| Friday, January 1, 2021 | 3042600000 | 1702700000 |
| Saturday, January 1, 2022 | 3476300000 | 4009800000 |
| Sunday, January 1, 2023 | 3484800000 | 7735000000 |
| Monday, January 1, 2024 | 3724400000 | 9566400000 |
Unleashing the power of data
In the ever-evolving landscape of global business, understanding cost dynamics is crucial. Ryanair Holdings plc and Hubbell Incorporated, two industry titans, offer a fascinating study in contrasts. From 2014 to 2023, Ryanair's cost of revenue surged by approximately 102%, reflecting its aggressive expansion and operational scale. In contrast, Hubbell's costs grew by about 55%, showcasing steady growth in the electrical products sector.
Ryanair's cost of revenue peaked in 2023, reaching nearly 7.7 billion, a testament to its robust market presence. Meanwhile, Hubbell's costs remained more stable, with a peak of 3.5 billion in the same year. Notably, 2021 marked a significant dip for Ryanair, with costs plummeting to 1.7 billion, likely due to pandemic-related disruptions.
While Hubbell's 2024 data remains elusive, Ryanair's continued growth trajectory is evident, with costs projected to hit 9.6 billion.
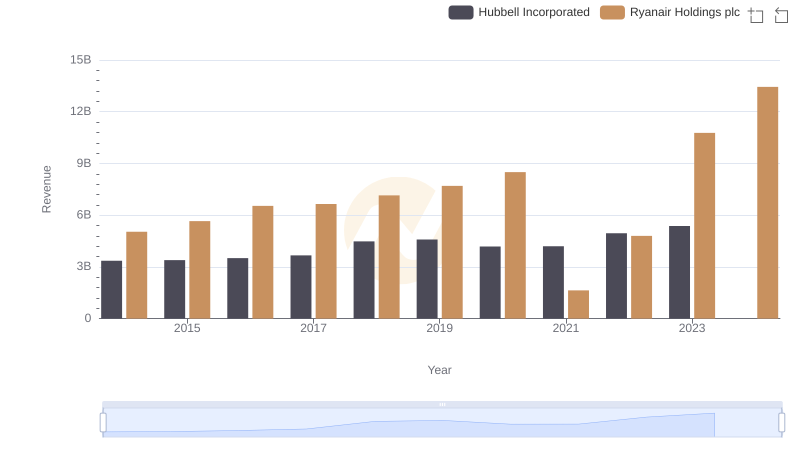
Ryanair Holdings plc vs Hubbell Incorporated: Annual Revenue Growth Compared
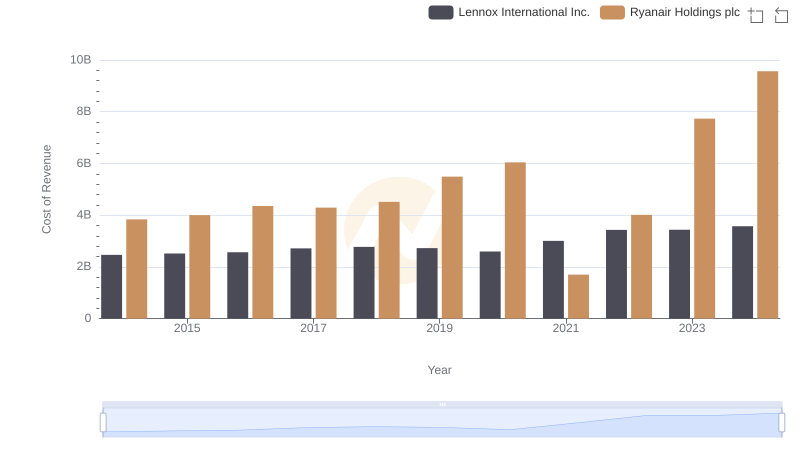
Ryanair Holdings plc vs Lennox International Inc.: Efficiency in Cost of Revenue Explored
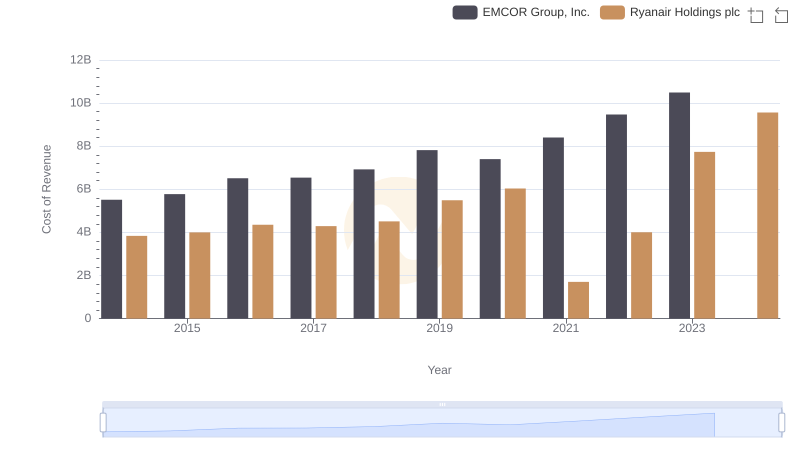
Cost of Revenue Comparison: Ryanair Holdings plc vs EMCOR Group, Inc.
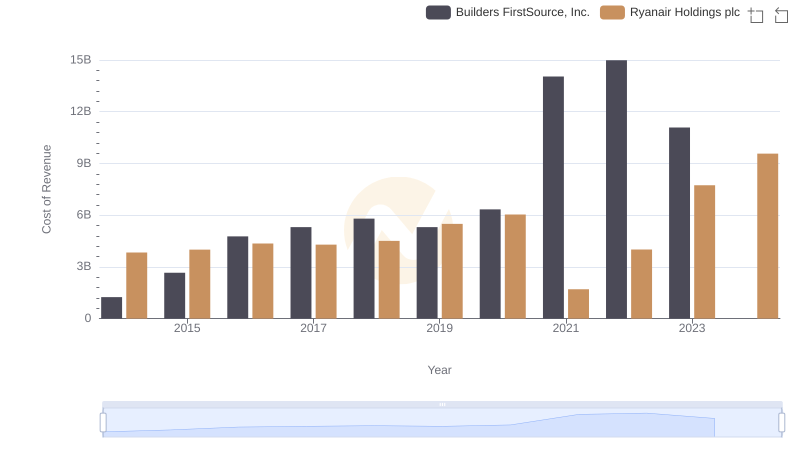
Analyzing Cost of Revenue: Ryanair Holdings plc and Builders FirstSource, Inc.
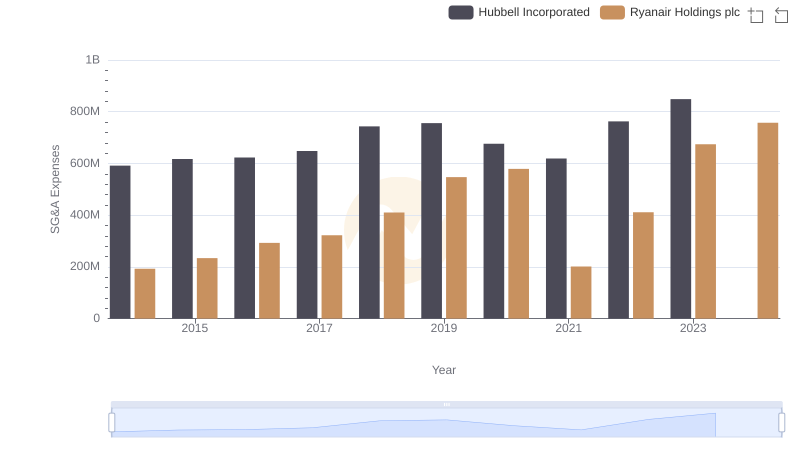
Operational Costs Compared: SG&A Analysis of Ryanair Holdings plc and Hubbell Incorporated
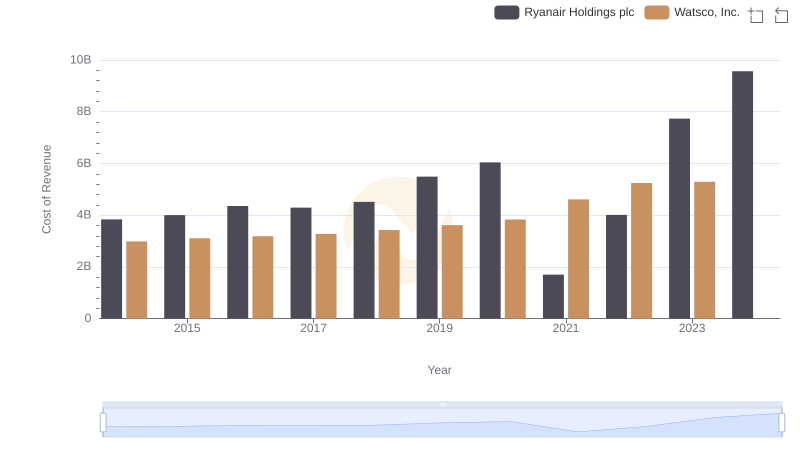
Cost of Revenue Trends: Ryanair Holdings plc vs Watsco, Inc.

Comparing Cost of Revenue Efficiency: Ryanair Holdings plc vs Southwest Airlines Co.
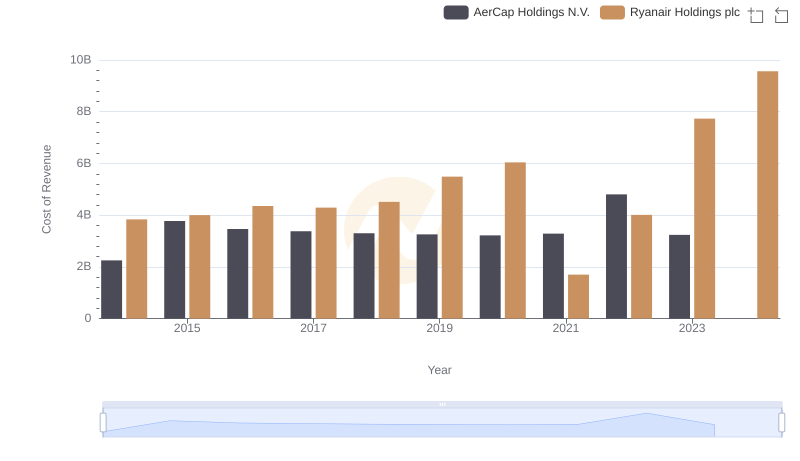
Cost of Revenue: Key Insights for Ryanair Holdings plc and AerCap Holdings N.V.
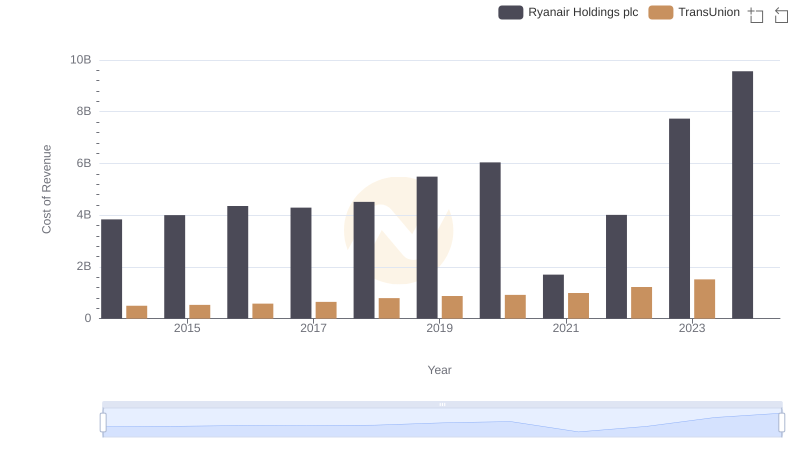
Ryanair Holdings plc vs TransUnion: Efficiency in Cost of Revenue Explored
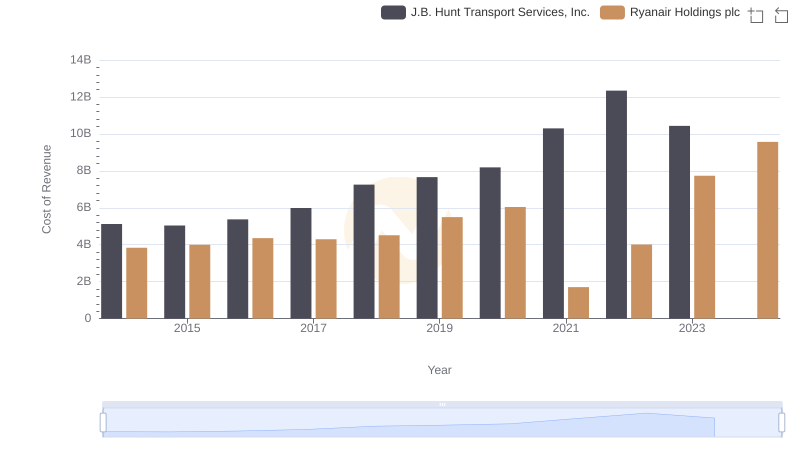
Ryanair Holdings plc vs J.B. Hunt Transport Services, Inc.: Efficiency in Cost of Revenue Explored
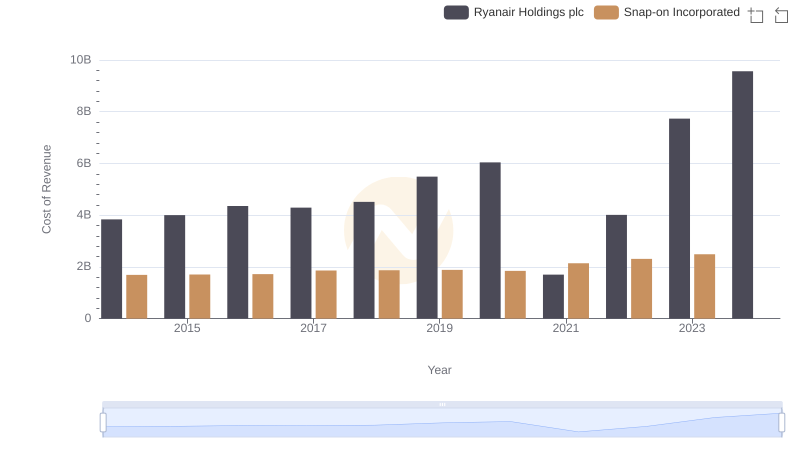
Comparing Cost of Revenue Efficiency: Ryanair Holdings plc vs Snap-on Incorporated
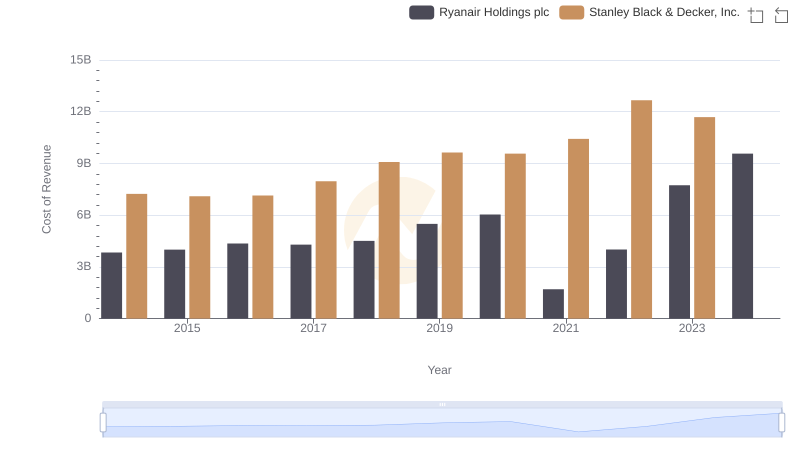
Cost of Revenue Trends: Ryanair Holdings plc vs Stanley Black & Decker, Inc.