| __timestamp | Builders FirstSource, Inc. | Ryanair Holdings plc |
|---|---|---|
| Wednesday, January 1, 2014 | 1247099000 | 3838100000 |
| Thursday, January 1, 2015 | 2662967000 | 3999600000 |
| Friday, January 1, 2016 | 4770536000 | 4355900000 |
| Sunday, January 1, 2017 | 5306818000 | 4294000000 |
| Monday, January 1, 2018 | 5801831000 | 4512300000 |
| Tuesday, January 1, 2019 | 5303602000 | 5492800000 |
| Wednesday, January 1, 2020 | 6336290000 | 6039900000 |
| Friday, January 1, 2021 | 14042900000 | 1702700000 |
| Saturday, January 1, 2022 | 14982039000 | 4009800000 |
| Sunday, January 1, 2023 | 11084996000 | 7735000000 |
| Monday, January 1, 2024 | 9566400000 |
Infusing magic into the data realm
In the ever-evolving landscape of global business, understanding the cost of revenue is crucial for assessing a company's financial health. This analysis delves into the cost of revenue trends for Ryanair Holdings plc and Builders FirstSource, Inc. over the past decade.
Ryanair, a leading European airline, has seen its cost of revenue fluctuate significantly. From 2014 to 2023, Ryanair's cost of revenue increased by approximately 102%, peaking in 2023. This growth reflects the airline's strategic expansion and operational adjustments in response to market demands.
Builders FirstSource, a major player in the construction industry, experienced a staggering 789% increase in its cost of revenue from 2014 to 2023. This surge underscores the company's aggressive growth strategy and the booming demand in the construction sector.
Both companies demonstrate how industry dynamics and strategic decisions shape financial outcomes, offering valuable insights for investors and analysts.
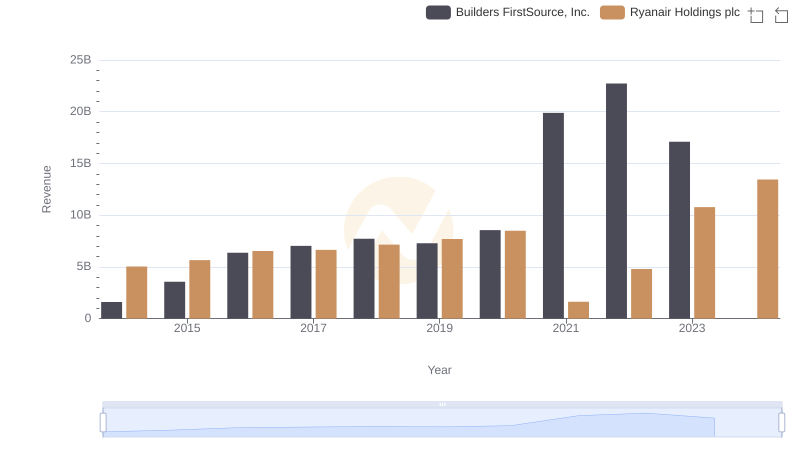
Breaking Down Revenue Trends: Ryanair Holdings plc vs Builders FirstSource, Inc.
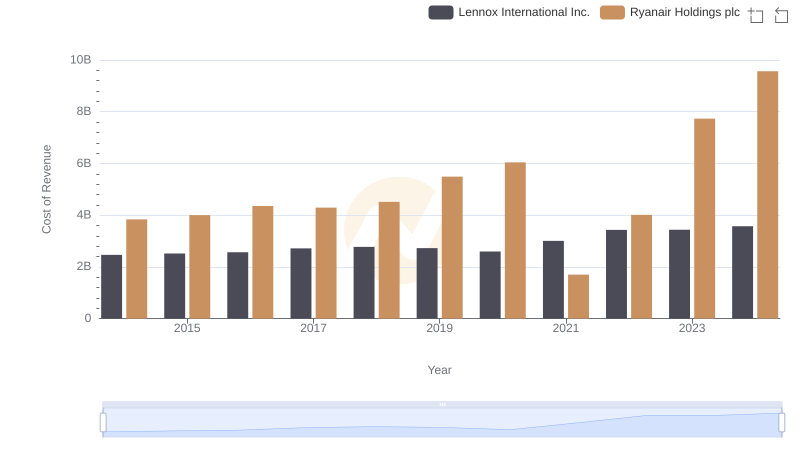
Ryanair Holdings plc vs Lennox International Inc.: Efficiency in Cost of Revenue Explored

Cost of Revenue Trends: Ryanair Holdings plc vs Hubbell Incorporated
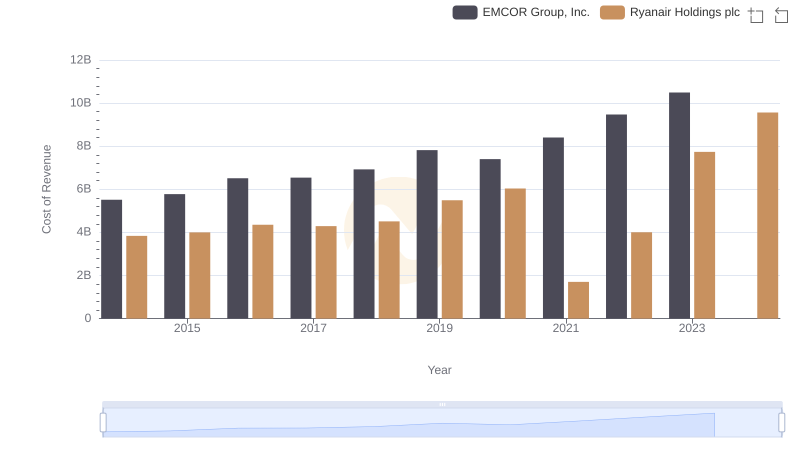
Cost of Revenue Comparison: Ryanair Holdings plc vs EMCOR Group, Inc.
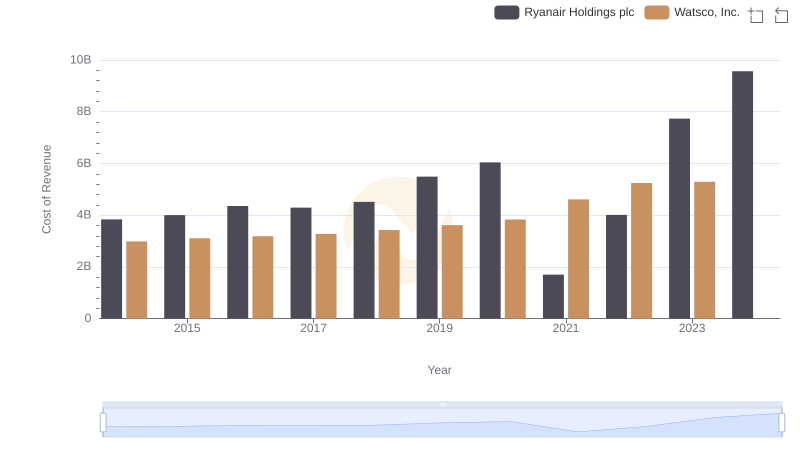
Cost of Revenue Trends: Ryanair Holdings plc vs Watsco, Inc.
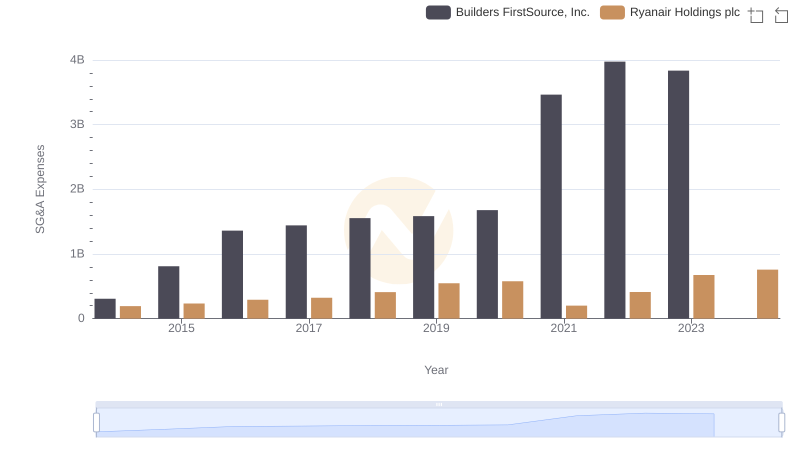
Cost Management Insights: SG&A Expenses for Ryanair Holdings plc and Builders FirstSource, Inc.

Comparing Cost of Revenue Efficiency: Ryanair Holdings plc vs Southwest Airlines Co.
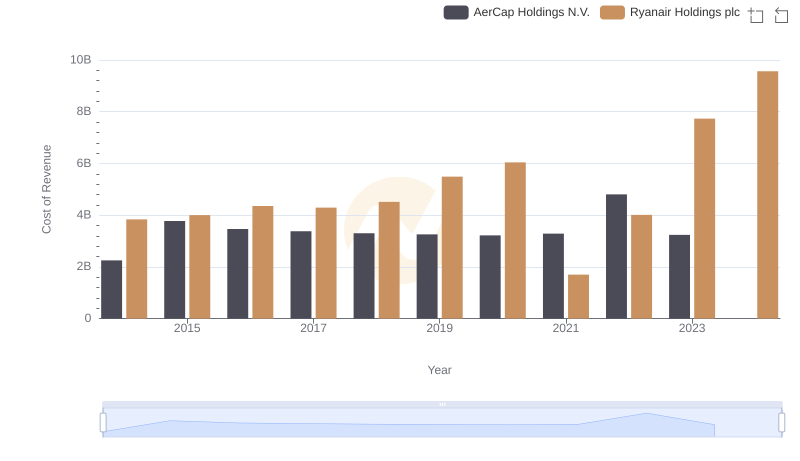
Cost of Revenue: Key Insights for Ryanair Holdings plc and AerCap Holdings N.V.
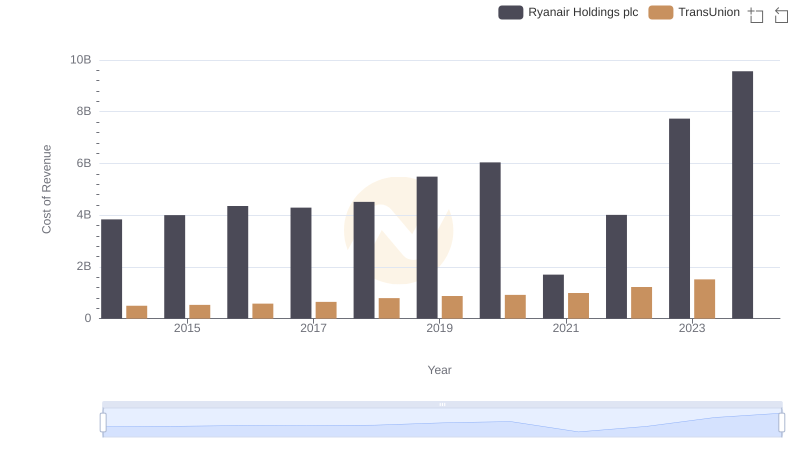
Ryanair Holdings plc vs TransUnion: Efficiency in Cost of Revenue Explored
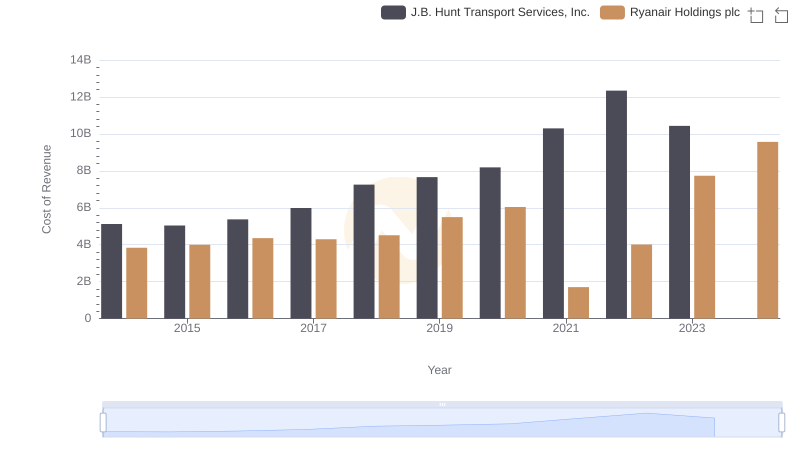
Ryanair Holdings plc vs J.B. Hunt Transport Services, Inc.: Efficiency in Cost of Revenue Explored
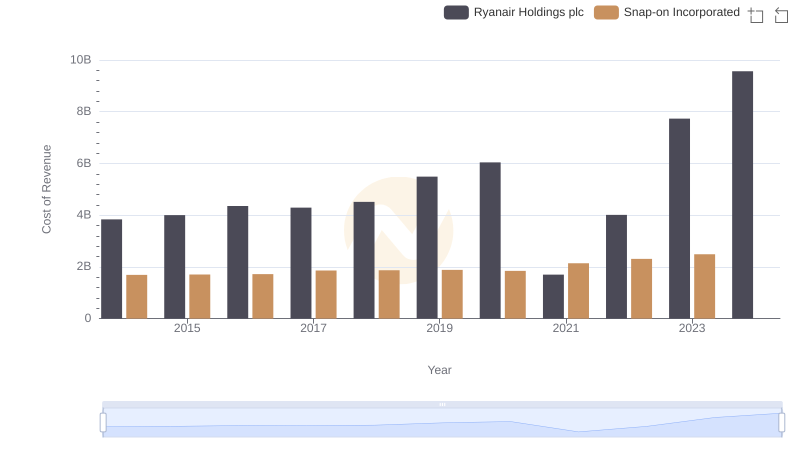
Comparing Cost of Revenue Efficiency: Ryanair Holdings plc vs Snap-on Incorporated
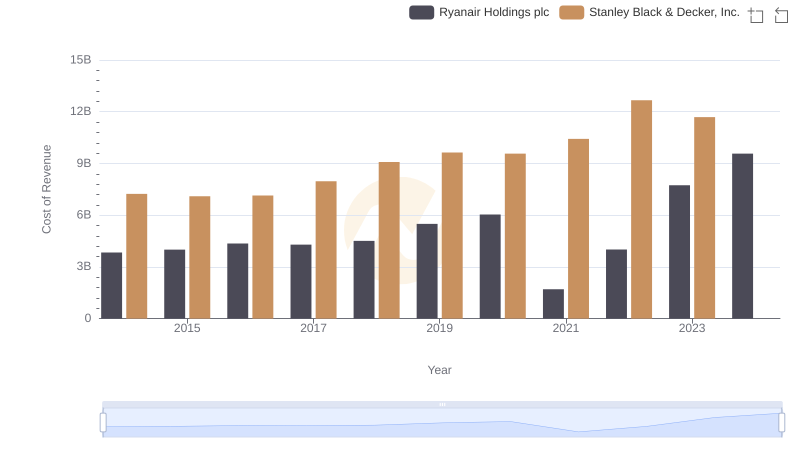
Cost of Revenue Trends: Ryanair Holdings plc vs Stanley Black & Decker, Inc.